Abstract:
Karachi is the world's fastest expanding metropolis, and it ranks among the world's largest cities. The disparity between public and private transportation utilisation in Karachi is growing by the day. To address this imbalance, private automobile users must change to more environmentally friendly modes of transportation. A travel behaviour study is required to shift people's mode of transportation from private to public transportation. As a result, the emphasis of this study is on the impact of socio-economic determinants on employee mode choice in Karachi. A survey was done using a self-administrative quantitative questionnaire to acquire information on travel habits. To examine the data, descriptive-analytic tests were used in SPSS. The study's findings leaned more toward the use of private transportation. There is no such thing as a beneficial influence of socio-economic characteristics on public transit use. This study might provide helpful information to stakeholders for future planning and development of sustainable transportation techniques in Karachi. The research findings will aid policymaking and serve as the foundation for future research on the mode choice model for P&RS.
Key Words:
Mode Choice, Socio-Economic, Travel Behavior, Karachi
Introduction
"A flourishing nation is one in which the privileged utilise public transit, not one in which the underprivileged have automobiles," remarked Gustavo Petro, Mayor of Bogota, Colombia.. In the early 1990s, some upper-middle-class Asian cities, such as Karachi, Bangkok, Seoul, and Kuala Lumpur, had reached income levels capable of supporting high levels of vehicle and motorcycle ownership (Barter 1999). Although the Kuala Lumpur metropolitan region could not be classified vehicle reliant expressly until recently, it is already at the moderate traffic congested' stage (Barter 2004). In Karachi, Bangkok, and Kuala Lumpur, public transportation accounts for less than one-third of all journeys, while private transportation accounts for the other two-thirds (Marcotullio & Lee 2003).
The dense structure of Karachi encourages the use of public transit and non-motorised transportation (NMT), which are sustainable and reasonable forms of transportation for poor and low-income populations (Ahmed et al., 2008). This can also fulfil the needs of around 22% of Pakistan's poor people (Ali 2006). Despite contrasts to densely populated structures and mixed land-use features in Asian cities, Asian cities are following Western nations' urban sprawl expansion and constructing their roads, expressways, and rapid transit systems (Ahmed et al., 2008). The cost of traffic congestion in Karachi is estimated to rise from $2.5 billion to $7.85 billion during the next ten years. It was discovered in a study undertaken by T-RTC (Toyota Research on Traffic Congestion) as a result of their commitment to societal sustainability (Recorder 2014).
Travel behaviour is heavily influenced by one's lifestyle and mindset (de Vos et al., 2012). In rapidly growing developing cities, it is difficult to understand and predict travel demand (Soomro et al., 2021, Qureshi et al., 2022). Mode choice is the policy-oriented component in the process of predicting and analysing travel demand management. Particularly, the analysis of the modal split of working people is intended to provide information about different policy measures (Ahmad 1995). Such as fare structures, fuel taxes, implementing of public transportation, and improving roads. It is also helpful in adopting sustainable transportation approaches. For instance, in planning for the bus system, the choice model can be used to predict the number of users who will adopt the system. Therefore, it is an achievement to use more efficiently of available capacity and also help in the resources which are invested in the expansion of the system (Kalwar et al., 2020).
The goal of this study is to look at the socio-economic aspects that impact travellers' mode choices and willingness to switch to public transportation if provided specific incentives (Talpur et al., 2016). The findings will be extremely useful in instilling some attention into policymaking. Attention is focused on work trips because it is of primary importance in urban travel and also the most regularised travel behaviour of urban habitats (Shah et al., 2021, Memon 2010, Memon 2021a).
Problem Background Karachi
Over the last decade, the fastest-growing metropolises have mostly been in developing countries. Karachi dominates the growth rate, with a staggering 80% increase in inhabitants between 2000 and 2010. Karachi has a population of roughly 20.88 million people and is recognised as the world's swiftest expanding metropolitan. (Kotkin & Cox 2013). Since the establishment of Pakistan, the city's population has increased 35 times, and its longitudinal expansion has increased about 16 times, with a yearly expansion rate of more than 5%. (Qureshi & Lu 2007), as shown in Table I.
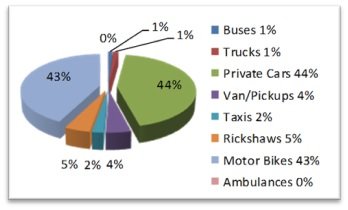
Karachi is Pakistan's main metropolitan and financial hub, and it is undergoing an unrestrained era of swift sprawl and motorisation (Memon 2016a, Memon et al., 2021b, Memon et al., 2016b) The city's rapid urbanisation and economic expansion have put enormous strain on travel demand. As around 33% of all vehicles in the country crowd on the country's highways and expressways, the increasing demand has swiftly saturated the roadway infrastructure (Qureshi & Lu 2007). According to Fig.I, Automobiles, including motorcycles, make for 87% of the fleet, while para-transit, cabs, and rickshaws account for 7% and public transportation accounts for 1%. This rapid growth in personal car ownership, coupled with a lack of market mechanisms such as paid parking and road tolls, has resulted in tremendous traffic, specifically in the downtown area, increasing Karachi's average commute travel time by more than 45 minutes (Qureshi & Lu 2007).
Table 1. Karachi metropolitan population and area growth rates (kotkin & cox 2013).
|
Year |
Population
(million) |
Area
(km2) |
|
1947 |
0.4 |
233 |
|
1981 |
5.3 |
1994 |
|
1998 |
9.8 |
3527 |
|
2004 |
14.0 |
3566 |
|
2010 |
20.8 |
More
than 3728 |
The requirements for urban transportation are cyclic in nature cities and are heavily influenced by inhabitants' travel habits (Ahmed et al., 2008). Table II shows the mode shares of two studies conducted by the Traffic Engineering Bureau of Karachi in 1987 and 2004. Although private vehicle journeys are rising, a 2013 study done by T-RTC (Toyota Research on Traffic Congestion) revealed that about 60% of travellers travel in private vehicles such as automobiles and motorcycles (Recorder 2014). The striking aspect is that buses/minibuses continue to meet more than half of the transport demand. As a result, buses/minibuses are the most common means of public transportation in Karachi. As a result, improved transportation management tactics, service, accessibility, and cost can aid in reducing the usage of private automobiles (Memon 2018, Memon et al., 2022).
Table 2. Trend of Mode Split at Karachi (Recorder 2014, Qureshi & Lu 2007)
|
Mode share (%) |
|||
|
Year |
Public
Transport |
Private
Transport |
Walking/Cycling |
|
1987 |
57 |
31 |
12 |
|
2004 |
52 |
48 |
-- |
|
2013 |
40 |
60 |
-- |
Table 2
Non-motorised travel is an eminent environmentally friendly mode of transportation. However, in Karachi, it is unpopular and is only used by low-income persons who could really access public transit. The percentage of trips taken by walking/cycling was 12% in 1987, according to the information in Table II, with no data in 2004. Alarming concerns about safety, an absence of policy and planning for pedestrians/cyclists, and encroached/ill-maintained routes are only a few of the reasons why lower and middle-class people do not use non-motorised transportation. Walkers are not only sensitive to air pollutants but are also the most common type of road accident victims, with almost 600 people killed in accidents involving vehicles in Karachi annually; more than half of them are pedestrians (Qureshi & Lu 2007).
It is estimated that about 50,000 automobiles drive in both ways daily, which exceeds the capability of the highways. This demonstrates the importance of adopting efforts to increase capacity to meet the future demands of expanding demand. (Recorder 2014). The administration is focused on the development of overpasses, underpasses, and new arterial highways to alleviate traffic congestion (Ahmed et al., 2008). These strategies include boosting traffic and increasing the usage of private transportation (Qureshi & Lu 2007). The authority is implementing traditional methods, which encourage private transport users instead of a sustainable method such as park-and-ride service (Qureshi & Lu 2007). As a result, there is significant inequity in the mode choice among public transportation and private transport users. (Ahmed et al., 2008, Qureshi & Lu 2007, Gakenheimer 1999)
Furthermore, a travel habit survey is required to meet the main goal. To identify the elements that impact passengers' mode of transportation in Karachi. As a result, the study's subject is to research the elements that impact travel patterns and modal selection, such as the socio-economic and demographic aspects of private and public transportation users. To get the desired funding for the study, the researcher followed the procedure in determining the technique of the study. Considering the foregoing discussions, the subsequent research questions emerge to aid in good knowledge and the identification of methods that can appeal to private transport users to park-and-ride services for potential marketing and design of park-and-ride facilities. (Brohi et al., 2021, Memon et al., 2014, Brohi et al., 2021b, Gill et al., 2021)
• What are the elements that determine travel mode choice in Karachi?
Study Execution and Methods
This study focuses mostly on employees or workers. Respondents will be chosen at random from work locations in Karachi's core business district (CBD), such as the city centre of the research districts. To make the research helpful, the scholar should solely focus on the working people of the subject region. There is no such restriction for responses since they are all employed persons who are plainly beyond the age of 18 and self-sufficient. There is another advantage to picking working individuals; they create their journeys at specified times when going and returning from their employment, and as previously indicated, it is especially important in metropolitan regions. As a result, most traffic surges during those peak hours, causing traffic congestion in cities. Another advantage for working individuals is the qualification element, which is frequently unimportant in their selection criterion. Almost all of the respondents are educated; however, their degree of education varies. The respondents were requested to engage in a study project of their own volition. If they consented, a self-administered questionnaire was distributed to them at their jobs.
The survey of the workers of Karachi was conducted and determined the specific variables which are affecting their mode of choice and willingness to shift their mode of transport from private mode to sustainable transportation approaches. Similarly, surveys collect information about passengers' actual trip selections, and this is referred to as a disclosed desire, as well as knowledge regarding hypothetical occurrences, which is known as asserted preference (Kalwar et al., 2022, Talpur et al., 2014, Ghaffar et al., 2021, Sahito, et al., 2020, Kalwar, et al., 2021) . The data from expressed preferences were studied to see if the travellers were willing to use alternative sustainable transportation methods.
This research comprises 100 samples, according to the well-known sample size of Krejcie and Morgan's calculation approach. (Krejcie, & Morgan, 1970). According to a study conducted at the University of Leeds in England, When separated into groups, the sample should be big enough that every category has a minimum number of participants of 100 (Pathan & Faisal 2010). To provide the intended demographic, a purposeful sampling strategy was used. Purposive sampling has a specific goal and technique that generally selects persons relevant to the intended region while leaving the mismatched with the study sample. This strategy is widely used in many fields of study that concentrate on a single topic (Shaikh et al., 2020, Kalwar et al 2019). This sampling strategy is very beneficial to transportation-related studies (Memon 2010). In general, the researcher targets respondents from the specified targeted group for the research to obtain an appropriate response. Surveys where data was collected and analysed using the Statistical Package for Social Sciences (SPSS). SPSS is a statistical analysis program.
Results and Discussions
The section provides survey analysis. Personal information and travel characteristics are separated into two parts of the survey questionnaire. The first portion concerning about sociodemographic data of revealed preferences. However, the second section about trip features is based on both disclosed and declared preferences. Similarly, the section discusses descriptive survey analysis. The explanatory analysis is based on the respondents' sociodemographic data and travel attributes.
As previously described in Section III of the study execution and methods, participants were chosen from Karachi's CBD (Central Business District) who are now employed. In Karachi, data was gathered by physical questionnaires distributed at workplaces.
Respondents Socio-Demographic Characteristics and Travel Pattern
This section explains the sociodemographic features and travel attributes of the chosen group. Initially, data was collected from the CBD of Karachi. The requirement of data was 100 respondents according to the distribution of the sample size. The researcher approached 200 people, and only 110 responses were recorded on questionnaires, out of which 100 were randomly selected and analysed.
Age in Comparison of Gender
In the survey of Karachi, age is distributed on five different scales, as shown in Fig.II. In overall terms, ninety respondents are male, and the remaining ten are female. Around ninety participants lie in-between the 21-50 years age group. Such that 30, 32, and 26 respondents belong to the 21-30, 31-40, and 41-50 age groups, respectively. Subsequently, eight respondents (including 1 female) are 51-60 years of age, and the remaining three male respondents are from 60 plus age group.
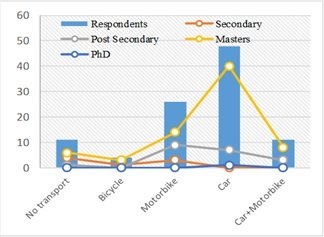
The level of education and ownership of a vehicle has a great impact on each other, as it is shown in Fig.III. It is visible from the collected data that exactly forty-eight employees’ ownership belongs to the car and around 40 respondents’ educational level is Masters, one is PhD and rest seven are just graduated(post-secondary).

Figure 2: Age in the comparison of gender
Cross relationship between Educational Level and Vehicle Ownership
Eleven per cent have a car and motorbike both; eight are masters, and three are graduated. There are only twenty-six respondents who have a motorbike, and their educational level is; fourteen Masters, nine graduated, and three belong to secondary education. There are very few near to negligible respondents. Around four have only bicycles as a mode of ownership. Thus, three are masters, and 1 is post-secondary. Only eleven people haven’t any mode of ownership, and they belong to different educational levels, but the majority have Masters, and no one is a PhD. This analysis shows that there are around seventy-one respondents who have a Master's, twenty post-secondary, eight Secondary, and only one PhD. Most of the master's and PhD qualified respondents have the ownership of a car or at least a motorbike. Few have bicycles or no mode of transport. It shows a significant relationship between ownership of a vehicle and level of qualification.
Household size
In the survey, more than 50 participants' household size is around five to seven persons. There is only one respondent who has a household size of one person only. Pakistan's average household size is 6.41, according to the report of the "Express Tribune with the International New York Times", 2015 (Tribune 2015). Around 13 people have a household size of more than 7 people. The second highest frequency of households is two to four people, which is 35 respondents.
Cross relationship between vehicle ownership and educational level.
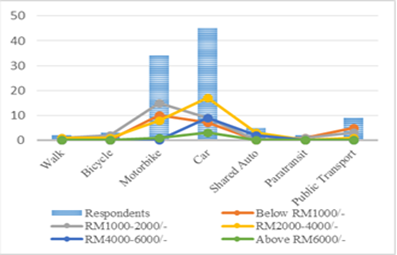
Mode of travel and Income
Respondents were categorized into five different monthly income levels: RM1000, RM1000-2000, RM 2000-4000, RM4000-6000, and above RM6000. Similarly, there were six mode choices; walk, bicycle, motorbike, car, shared auto, para-transit, and public transportation. Fig.IV reveals that almost all income levels' respondents prefer motorbike or car as a travelling source for a home to office journey. Fig.IV also reveals that the choice of public transport or alternative modes decreases as income level increases, where a choice of motorbike and car remains favourable.

Choice of mode by income levels
Cross Tabulation
Cross tabulation compares different factors with each other. Such as, in Table.III, the type of transport ownership is compared with the age of respondents and gender. Around 60 respondents have ownership of a car as discussed previously. It is observed that all female respondents have ownership of a car except one who has a car and motorbike both. In the comparison of transport ownership and age respondents, 31 respondents belonged to the 21-30 years age group, and majorly they own their mode of transportation except for five people. Similarly, 32 respondents belong to the 31-40 age group; only five people have no transport ownership, and two respondents have a bicycle. The rest of them have their mode of transport. Twenty-six respondents are from the 41-50 age group and majorly of them have car ownership, three of them have only motorbike and one has bicycle ownership, and there is only one who has no ownership of transport. Only eight respondents belonged to the 51-60 age, and only one of them had a bicycle and one had a motorbike rest of them had car ownership. Finally, the three respondents' age group was 60+; one has a motorbike and two have ownership of a car.
Table 3. Cross Tabulation of Gender, Age, and Transport Ownership of Respondents
|
Type of Transport Ownership |
Age of Responder |
Total |
||||||
|
21-30 |
31-40 |
41-50 |
51-60 |
60+ |
||||
|
None |
Gender |
Male |
5 |
5 |
1 |
|
|
11 |
|
Bicycle |
Gender |
Male |
|
2 |
1 |
1 |
|
4 |
|
Motorbike |
Gender |
Male |
16 |
5 |
3 |
1 |
1 |
26 |
|
Car |
Gender |
Male |
6 |
17 |
13 |
2 |
2 |
40 |
|
Female |
2 |
3 |
3 |
0 |
0 |
8 |
||
|
Total |
8 |
20 |
16 |
2 |
2 |
48 |
||
|
Car + motorbike |
Gender |
Male |
1 |
|
5 |
3 |
|
9 |
|
Female |
1 |
|
0 |
1 |
|
2 |
||
|
Total |
2 |
|
5 |
4 |
|
11 |
||
Consequently, the cross-tabulation analysis of Table IV shows the mode of travelling from home to office and office to home concerning age group and gender. According to this analysis, females prefer their mode of travelling instead of public transport or para-transit. Analysis shows that there are only 2 people who walked to their office, and they belong to the 31-40 age group. Bicycle is rarely used for the mode of travelling as here only 3 people are using the bicycle in different age groups. Accordingly, motorbikes and cars are one of the major sources of travelling as 34 respondents used motorbikes, and around half of the respondents used cars as a mode of travelling to the office. There are very few; 5 respondents' source of travelling is shared auto, and only two travellers use para-transit. Public transportation is hardly used by 10 per cent of people as only 9 respondents are travelling in it and most of them belong to a young age group.
Table 4. Cross Tabulation of Gender, Age, and Mode of Travelling
|
Mode of Travelling |
Age of Responder |
Total |
||||||
|
21-30 |
31-40 |
41-50 |
51-60 |
60+ |
||||
|
Walking |
Gender |
Male |
|
2 |
|
|
|
2 |
|
Bicycle |
Gender |
Male |
|
1 |
1 |
1 |
|
3 |
|
Motorbike |
Gender |
Male |
16 |
7 |
6 |
3 |
1 |
33 |
|
Female |
0 |
0 |
0 |
1 |
0 |
1 |
||
|
Total |
16 |
7 |
6 |
4 |
1 |
34 |
||
|
Car |
Gender |
Male |
5 |
15 |
11 |
3 |
2 |
36 |
|
Female |
3 |
3 |
3 |
0 |
0 |
9 |
||
|
Total |
8 |
18 |
14 |
3 |
2 |
45 |
||
|
Shared auto |
Gender |
Male |
|
2 |
3 |
|
|
5 |
|
Para-transit |
Gender |
Male |
1 |
|
1 |
|
|
2 |
|
Public transport |
Gender |
Male |
6 |
2 |
1 |
|
|
9 |
The below cross-tabulation analysis in Table V is quite interesting. This analysis elaborates on the mode choice concerning the ownership of a vehicle and income per month. As is discussed above that, only two people do walk, and one of them has no car, and his income is around RS. 100,001-200,000/- and another has a car and belongs to the RS.50,000-100,000/- income group. Therefore, it can be assumed that maybe they are living near to their workplaces in CBD, that's why they are favouring walking instead of any other mode choice. Similarly, only three respondents used a bicycle, one of them only owned a bicycle, and the rest also owned a car and motorbike. The users of a motorbike as a mode of travelling majorly are the owner of only motorbike except a few who have a different mode of ownership. There are 59 car owners. Of them, 45 respondents are using a car as a mode of travelling, and almost all belong to all income groups. In the same way, 5 people use shared auto, from them four are the car owners has no ownership of any vehicle. Para-transit such as taxi or rickshaw is adopted by two people; one has no ownership of a car and belongs to below RS.50,000/- income group and another is a car owner, but he belongs to under RS.50,001-100,000/- income group. There are nine public transport users. From them seven don't have any vehicle and majorly belongs to the under RS. 50,000/- age group two are car owners, but their income is under RS.50,001-100,000/- per month. Therefore, they prefer public transportation as a source of travelling.
Table 5. Cross-tabulation of mode of travelling, ownership, and income per month
|
Mode of Travelling |
Income per Month |
Total |
||||||
|
Below RS. 50,000/- |
RS. 50,001-100,000/- |
RS. 100,001-200,000/- |
RS. 200,001-300,000/- |
RS. 300,000/- above |
||||
|
Walking |
Type of transport ownership |
None |
|
0 |
1 |
|
|
1 |
|
Car |
|
1 |
0 |
|
|
1 |
||
|
Total |
|
1 |
1 |
|
|
2 |
||
|
Bicycle |
Type of transport ownership |
Bicycle |
|
1 |
0 |
|
|
1 |
|
Car + Motorbike |
|
1 |
1 |
|
|
2 |
||
|
Total |
|
2 |
1 |
|
|
3 |
||
|
Motorbike |
Type of transport ownership |
None |
0 |
0 |
1 |
|
0 |
1 |
|
Bicycle |
0 |
1 |
2 |
|
0 |
3 |
||
|
Motorbike |
10 |
13 |
1 |
|
1 |
25 |
||
|
Car + Motorbike |
0 |
1 |
4 |
|
0 |
5 |
||
|
Total |
10 |
15 |
8 |
|
1 |
34 |
||
|
Car |
Type of transport ownership |
Car |
5 |
8 |
17 |
8 |
2 |
40 |
|
Motorbike |
0 |
1 |
0 |
0 |
0 |
1 |
||
|
Car + Motorbike |
2 |
0 |
0 |
1 |
1 |
4 |
||
|
Total |
7 |
9 |
17 |
9 |
3 |
45 |
||
|
Shared auto |
Type of transport ownership |
None |
|
|
0 |
1 |
|
1 |
|
Car |
|
|
3 |
1 |
|
4 |
||
|
Total |
|
|
3 |
2 |
|
5 |
||
|
Para-transit |
Type of transport ownership |
None |
1 |
0 |
|
|
|
1 |
|
Car |
0 |
1 |
|
|
|
1 |
||
|
Total |
1 |
1 |
|
|
|
2 |
||
|
Public transport |
Type of transport ownership |
None |
5 |
1 |
1 |
|
|
7 |
|
Car |
0 |
2 |
0 |
|
|
2 |
||
|
Total |
5 |
3 |
1 |
|
|
9 |
||
Conclusion and Recommendations
Based on the results and discussions of the research, it is found that most of the employees prefer their mode of transport and the majority of respondents have ownership of transport, such as motorbike and car. It is also observed that lower-income people prefer motorbikes as a mode of transport instead of public transport or para-transit. Education also has a positive impact on the ownership of a private vehicle and also on choosing a private mode of transport for their trips. In conclusion, all the factors harm the usage of public transport, but on the other hand, it is also a fact that still Karachi lacks a good and sustainable public transportation system, and there is no such kind of service. Therefore, most travellers prefer to use their mode of transport.
To overcome the imbalance between private and public mode choice, there is a requirement for the implementation of a good and sustainable mass transit system. Before implementing this system, the government needs to perform a travel pattern study and need to know the attributes which are influencing the people to select modal split. Travel behaviour surveys will enhance public transportation assistance; It is a well-known strategy for launching a sustainable transportation strategy. Moreover, it expands on the factors that influence the use of public transit demand management strategy.
These research outcomes support policymakers ‘future planning and development of public transportation systems. Also, provides a foundation for future research on the park-and-ride mode choice model.
References
- Ahmad, N. (1995). Choice of Mode for the Worktrip in a Third World City: Karachi. The Pakistan Development Review, 34(2), 149–164. . https://doi.org/10.30541/v34i2pp.149-164
- Ahmed, Q. I., Lu, H., & Ye, S. (2008). Urban transportation and equity: A case study of Beijing and Karachi. Transportation Research Part A: Policy and Practice, 42(1), 125–139. https://doi.org/10.1016/j.tra.2007.06.004.
- Ali, S. (2006). Managing urban poverty. Council for Social Development,Uppal Pub. House.
- Barter, P. (2004). Transport, urban structure and “lock-in†in the Kuala Lumpur Metropolitan Area. International Development Planning Review, 26(1), 1– 24.
- Barter, P. A.(1999). An international comparative perspective on urban transport and urban form in Pacific Asia: The challenge of rapid motorisation in dense cities. Murdoch University. Division of Social Sciences, Humanities Education.
- Brohi, S., Kalwar, S., Memon, I. A., & Ghaffar, A. (2021b). Using the Theory of Planned Behavior to Identify the Behavioral Intention to use Public Transportation Service: The Case Study of Karachi Circular Railway. International Journal on Emerging Technologies, 12(1), 317– 322.
- Brohi, S., Memon, I. A., Kalwar, S. & Sahito, N. (2021a). Predicting The Use Of Public Transportation Service: The Case Study Of Karachi Circular Railway. PalArch's Journal of Archaeology of Egypt / Egyptology, 18(03), 13.
- de Vos, J., Derudder, B., van Acker, V., & Witlox, F. (2012). Reducing car use: changing attitudes or relocating? The influence of residential dissonance on travel behavior. Journal of Transport Geography, 22, 1–9.
- Gakenheimer, R. (1999). Urban mobility in the developing world. Transportation Research Part A: Policy and Practice, 33(7–8), 671–689.
- Ghaffar, A., Kalwar, S., Memon, I. A., Brohi, S., & Sahito, N. (2021). EVALUATING ACCESSIBILITY OF PUBLIC PARKS THROUGH GIS: A CASE STUDY OF TANDO ALLAHYAR CITY. PalArch's Journal of Archaeology of Egypt/ Egyptology, 18(2), 758-771.
- Gill, R., Kalwar, S., Memon, I. A., & Chandio, I. (2021). Yeh's Satisfaction Index Modelling of Tenants in Rental Appartments: A Case Study of Latifabad, Hyderabad. Sukkur IBA Journal of Computing and Mathematical Sciences, 4(2), 1– 10.
- Kalwar, S., Memon, I. A., & Qureshi, S. (2021). Significance of National Spatial Planning for Economic Development of Secondary Cities in India: Critical Analysis of JNNURM Programme. Sukkur IBA Journal of Computing and Mathematical Sciences, 4(2), 49-60.
- Kalwar, S., Sahito, N., Memon, I. A., Hwang, J., Mangi, M. Y., & Lashari, Z. A. (2019). National Planning Strategies for Agro- based Industrial Development in Secondary Cities of Sindh Province, Pakistan. Sustainability, 11(24), 7066.
- Kalwar, S., Sahito, N., Qureshi, S., & Memon, N. (2020). Average Index Modelling of Campus Safety and Walkability: The Case Study of University of Sindh. Sukkur IBA Journal of Computing and Mathematical Sciences, 4(1), 37–44.
- Kalwar, S., Samoo, S., Memon, I. A., & Sahito, N. (2022). A comparative analysis of urbanization trends of Hyderabad and Sukkur. Academy of Strategic Management Journal, 21(S2), 1– 9.
- Kotkin, J. & Cox, W. (2013). "The World's fastets-growing megacities." Forbes.
- Krejcie, R. V., & Morgan, D. W. (1970). Determining Sample Size for Research Activities. Educational and Psychological Measurement, 30(3), 607–610.
- Marcotullio, P., & Lee, Y. S. (2003). Urban environmental transitions and urban transportation systems: A comparison of the North American and Asian experiences. International Development Planning Review, 25(4), 325–354.
- Memon, I. A. (2010). Factors influencing travel behaviour and mode choice among Universiti Teknologi Malaysia employees. Universiti Teknologi Malaysia.
- Memon, I. A. (2018). Mode Choice Modelling to Shift Car Travelers Towards Park and Ride Service in the CBD of Putrajaya and Karachi. Universiti Teknologi PETRONAS, 2018.
- Memon, I. A. et al., (2021b). Mode choice modeling to shift car travelers towards park and ride service in the city centre of Karachi. Sustainability, 13(10), 5638.
- Memon, I. A., Aftab Hussain Talpur, M., Hakro, R., & Napiah, M. (2016b). Mode Choice Modelling Method to Shift Car Travelers Towards Park and Ride Service. Journal of Engineering and Applied Science, 11(06), 3677–3683.
- Memon, I. A., Kalwar, S., Sahito, N., & Napiah, M. B. (2021a). Factors that Influence Travelers’willingness to use or not Park- And-Ride Service in Putrajaya and Karachi Cbd. PalArch's Journal of Archaeology of Egypt/Egyptology, 18(2), 720– 734.
- Memon, I. A., Madzlan, N., Talpur, M. A. H., Hakro, M. R., & Chandio, I. A. (2014). A Review on the Factors Influencing the Park-and-Ride Traffic Management Method. Applied Mechanics and Materials, 567, 663–668.
- Memon, I. A., Soomro, U., Qureshi, S., Chandio, I. A., Talpur, M. A. H., & Napiah, M. (2022). Multilayer Perceptron Modelling of Travelers Towards Park- and-Ride Service in Karachi. Springer International Publishing, in Advances in Road Infrastructure and Mobility, 1026– 1038
- Memon, I., Napiah, M., Hussain, M., & Hakro, M. (2016a). Influence of factors to shift private transport users to Park-and-Ride service in Putrajaya. Civil, Offshore and Environmental Engineering, 385–389.
- Pathan, H. & Faisal, A. (2010). Modelling travellers' choice of information sources and of mode. PhD thesis, University of Leeds.
- Qureshi, I. A., & Lu, H. (2007). Urban transport and sustainable transport strategies: A case study of Karachi, Pakistan. Tsinghua Science and Technology, 12(3), 309–317.
- Qureshi, S., Memon, I. A., & Talpur, M. A. H. (2022). Association between Objectively Measured Neighbourhood Built Environment and Walkability. Mehran University Research Journal of Engineering and Technology, 41(1), 157– 168.
- Recorder, B. (2014). "Research report reveals: traffic congestion cost to swell to $7.85 billion in next 10 years." Business Recorder.
- Sahito, N., Kalwar, S., Memon, I. A., Lashari, Z. A., Mangi, M. Y., & Hussain, A. (2020). EXAMINING RAPID LAND-USE VARIATION USING MULTICRITERIA DECISION ANALYSIS (MCDA) METHOD. PONTE International Scientific Researches Journal, 76(7).
- Shah, M. H., Memon, I. A., Talpur, M. A. H., Sethar, W. A., & Das, G. (2021). FactorsInfluencing Private Transport Users to Shift Towards Public Transport In Karachi. ENGINEERING SCIENCE AND TECHNOLOGY INTERNATIONAL RESEARCH JOURNAL, 5(1), 61– 65.
- Shaikh, K., Ahmed Memon, I., Memon, A., & Ali Laghari, Z. (2020). Awareness regarding Coronavirus pandemic among the population of Sindh, Pakistan: A cross-sectional study. Sukkur IBA Journal of Computing and Mathematical Sciences, 4(1), 28–36.
- Soomro, F., Kalwar, S., Memon, I. A., & Kalwar, A. B. (2021). Accessibility Factor for Boulevard Shopping Mall, Hyderabad City, Pakistan. International Research Journal of Innovations in Engineering and Technology, 05(10), 19–22.
- Talpur, M. A. H., Chandio, I. A., Memon, I. A., & Napiah, M. (2016). A Brief Review onthe Role of Regional Transport Accessibility in the Development Process of Distant Sub-Regions. Indian Journal of Science and Technology, 9(13), 1–9.
- Talpur, M. A. H., Chandio, I., Ahmed Memon, I., & Ahmed Qureshi, T. (2014). Computer-Based Database System: Rapid Response for Rural Planning Agencies to Devise Transport Policies. Indian Journal of Science and Technology, 7(10), 1603– 1612.
- Tribune, T. E. (2015). "Survey: Pakistanis were better off in 2011-12 than preceding year."
Cite this article
-
APA : Marvi, H., Soomro, M., & Memon, I. A. (2022). Influence of Socio-economic Factors on Mode Choice of Employees in Karachi City. Global Economics Review, VII(II), 124-136. https://doi.org/10.31703/ger.2022(VII-II).11
-
CHICAGO : Marvi, Hina, Mehnaz Soomro, and Irfan Ahmed Memon. 2022. "Influence of Socio-economic Factors on Mode Choice of Employees in Karachi City." Global Economics Review, VII (II): 124-136 doi: 10.31703/ger.2022(VII-II).11
-
HARVARD : MARVI, H., SOOMRO, M. & MEMON, I. A. 2022. Influence of Socio-economic Factors on Mode Choice of Employees in Karachi City. Global Economics Review, VII, 124-136.
-
MHRA : Marvi, Hina, Mehnaz Soomro, and Irfan Ahmed Memon. 2022. "Influence of Socio-economic Factors on Mode Choice of Employees in Karachi City." Global Economics Review, VII: 124-136
-
MLA : Marvi, Hina, Mehnaz Soomro, and Irfan Ahmed Memon. "Influence of Socio-economic Factors on Mode Choice of Employees in Karachi City." Global Economics Review, VII.II (2022): 124-136 Print.
-
OXFORD : Marvi, Hina, Soomro, Mehnaz, and Memon, Irfan Ahmed (2022), "Influence of Socio-economic Factors on Mode Choice of Employees in Karachi City", Global Economics Review, VII (II), 124-136
-
TURABIAN : Marvi, Hina, Mehnaz Soomro, and Irfan Ahmed Memon. "Influence of Socio-economic Factors on Mode Choice of Employees in Karachi City." Global Economics Review VII, no. II (2022): 124-136. https://doi.org/10.31703/ger.2022(VII-II).11