01 Pages : 1-12
Abstract:
This article examines the determinants of the total productivity of the agriculture sector which enhances the total agricultural productivity in Pakistan and analyzes the relations among variables used for the analysis from 1990 - 2017. The application of the auto regressive distributed lag technique ARDL was used to approximate various determinants. The area under cultivation, fertilizer consumption, agriculture credit, and rainfall show a positive effect on agriculture productivity, whereas agriculture employment and pesticide consumption show a positive but statistically insignificant effect on agricultural productivity in the long run. While in the short-run all determinants have a positive and significant effect on total agriculture productivity convergence towards equilibrium is shown by error correction term is 0.829.
Key Words:
Agriculture, Productivity, ARDL
Introduction
The agricultural sector is the backbone of the Pakistan economy and the largest contributor to GDP after services. In the time of independence agriculture was the principal sector but due to climate change, political and economic conditions their performance is declining: the production and yield goes down gradually day by day. This industry has a notable rate of growth with 3.8 % and beat its goal with a growth of 3.5%. It accounts for over (18.9%) of GDP and absorbs 42.3 percent out total labor force in this sector (Economic Survey of Pakistan 2017-18). About 63% of people are living in rural areas of the country associated directly or indirectly to this sector for their occupations. Foreign exchange is earned through agriculture exports and encourages growth in the other sectors of the economy.
The small scale farmers and encourages small scale innovation technologies that contribute to agricultural growth in the economy. The 6th Housing and Population Census of Pakistan 2017 shows the population of the country is rising by 2.4% per year. This high growth of population is raising the demand for agriculture production. However, this sector is the main provider of raw materials to agro-based industry, which contributed to the exports of the country; the agricultural industry is one of the biggest markets for industrial goods like fertilizers, pesticides, tractors, and other agriculture machinery. The objective of agriculture has changed from “traditional farming” to “market-based farming”. Farming supplies also changed from self-production to market-based. Correspondingly, this idea of self-reliance has been changed to a profit-maximizing level. GDP is the main indicator to measure the country's growth pattern. The World Bank indicates Pakistan's GDP was $161.99 Billion or PK rupees 5,475,716 Million in 2009.
Pakistan is the fourth largest cultivator and provider of Rice, Wheat Rice, and cotton. Rice is one of the main exporting crops of the economy. From 2017 to 2018, the cultivated area under wheat crop was 8,734 thousand hectares indicating the decline of 2.6% as a contrast to 8000 hectares in the previous period. The total production of Wheat is 25.492 million tons in 2017 showing the fall of 4.4 % over the production of 26.674 million tons over the previous year. Sugarcane is one of the essential parts of major crops cultivated for sugar and sugar-related products. Minor crops include vegetables oil-producing seeds, all pulses, and other small crops. Oilseeds consist of the seeds of cotton, rapeseed/mustard, sunflower, and canola, etc. Livestock includes sheep, goats, cows, buffalos, and, cattle, and poultry. Camels and horses are the vital sub-sector of the agricultural sector. The livestock sector has a share of 58.92% in agriculture and 11.11 % of GDP, showing a growth rate of 3.76% as compared with 2.99% in the previous time period. The Government has included the sector of livestock in a countrywide development program and has made a development policy in this sector with the involvement of the Private sector.
By recent estimates, dairy is the big sector of Pakistan and is the 4th biggest milk supplier globally The recent level of production is about thirty-five billion litres in gross production in 2017-18 is 57,890 (000 tons) and human consumption is 46,682 (000 tons). Meat production is 4,262 (000 tons), beef is 2,155(000 tons), while boultry is 1,391(000 tons) and other Poultry in this branch also supplies meat for exports. The amount of 30.450 (000) tones of red meat were exported during the time period of 2017-2018 (July-to Feb.). This brings the amount to US $ 105.541 million. For about 50 million animals there are eight and million farming households. ilk supplied in Pakistan is worth 177 billion rupees. Fisheries play a central role in Pakistan and are considered to be a source of employment for the coastal population. Fisheries include maritime fishery, inland fisheries (consisting of rivers, lakes, ponds, and dams, etc.) are the main activity in the country. Fisheries contribute around 0.4% to GDP while in export earnings the shares are not small. The coastal belt of Pakistan is around 1050 kilometers and a well-known zone of fishery in the country, which supplies best class seafood exports to different states of the world such as China, Kingdom of Thailand, United Arab Emanates and other Arabian states. Fresh, chilled and frozen fish comprise about 69%and shrimps approximately 21% share in the country exports.
The price of food items in the country has risen amazingly from the last decade, pushing a larger quantity of the population under the line of poverty. The reduction in poverty is by enhancing agriculture productivity as suggested by (Odhiambo et al, 2004), by identifying the determinants of total agricultural productivity (TAP). The suitable policies can be adapted that accrue agricultural productivity & foodstuff of the economy.
Study Goals
1. To determine the significance of the determinants of agricultural productivity in Pakistan.
2. To find out the impact of major factors on agriculture productivity in the country.
3. To assess the long run and short-run performance of productivity determinant and their effect on agriculture productivity in the economy.
Review of Previous Studies
The vast literature of agriculture productivity cannot be ignored because productivity plays a central role in agriculture and economic growth. Agri productivity is increased by increasing their determinants. Most of the Studies on estimating the total factor productivity are relatively huge in number than the other research works in relation to agricultural productivity determinants in the background of Pakistan. Different works done related to this topic have miscalculated total factor productivity; input measures are not correct. The literature on agriculture productivity includes Azhar (1991) who used the cross-sectional data obtained from WAPDA to judge the effect of improved varieties joint with farmer’s base of education on arable farm productivity. This study explains an outcome that improved the variety of wheat joint to the farmer’s education rising significantly farm productivity as in the hypothesis.
Ahmad (2001) examines agricultural productivity growth at 3 levels in districts of Punjab, crop zones, and at the provincial level. The estimated figures show that crop output rose by 2.6% per annum, predominantly the share of total factor productivity growth. The region of the mung bean comes out as a leader with 3.6 percentage point growth/year in TFP, followed by barani 3.2 percent, cotton (1.9%), mixed (1.1%), and rice (1%) zones. Rice, mixed, and cotton regions indicate a negative trend in the growth of TFP. Ahmad, Chaudhary, et.al (2008) evaluated the tendency in total factor productivity in the agriculture sector of Pakistan and establish the total factor productivity is a vital source of growth.
Kiani et al (2008), used ARDL with various lag length qualifications to estimate the effect of research expenditure on TFP applied time series data for the time-span of 1972 to 2004, and for the subsector of the crop in Pakistani Punjab. The study outcome revelaed that lag length eight as compared to ten and twelve was best fit as indicated by adj. R2 was furthest. Tractors, road kilometers, and yield variety seed give out considerably which better TFP during the reference era. However, the tube wells have no significant effect on TFP. With the addition of a lag, the coefficient was 0.13 which explains 10% increase in research expenditure and improves the TFP by 1.32 percentage points. Furthermore, they calculated IRR on research expenditure up to 88 percentage points for eight lags& 75 % and 57 % for ten and twelve lags, respectively.
Awan (2014) estimated the determinant of agri-productivity growth, experiencing growth and its effect on the economic growth of seven countries which compared their experience with 7 developed economies. The employment Share of agricultural, productivity of labor in the agriculture sector, transitional inputs ratio and collective worker productivity were used as economic variables. The study outcome illustrates that due to low agricultural productivity in the emerging economies and the income gap between emerging and developed economies, there is a negative impact on the economic growth in the selected emerging nations.
Description of Variables Total Agriculture Productivity
“Agriculture Productivity defined as a ratio of a volume measure of output to a volume
measure of input use” (OECD 2001b). We use the crop production index for total agricultural productivity TAP and used as a dependent variable
Area under Cultivation
The land is crucial & unavoidable for agricultural production. Any agricultural outcome cannot be possible without land. The use of sufficient land for cultivation makes the efficient use of all inputs. If cultivated land is insufficient different inputs, such as agricultural equipment, inorganic fertilizer, tube-wells, chemical pesticides and labor inputs remain underutilized. Suitable land available cultivated ensures efficient use of necessary inputs which enhances agriculture productivity. We use arable land as a percent of total land for the area under cultivation; it is an important determinant of agriculture productivity. It increases the total agriculture productivity and its expected sign is positive.
Agriculture Employment
Labor is the main determinant of total agriculture productivity TAP. The labor force is attached to this agriculture sector plays a significant role in improving total agriculture TAP. The land is fixed: when employment is increased the labor productivity is also increased. The agriculture employment has measured employment in agriculture as a percent of total employment. The expected sign of AEMP is positive.
Fertilizer
Fertilizer is another crucial determinant of agricultural productivity which considerably boosts nutrients in the soil and increased the yield of per acre. Furthermore, the effect of fertilizer on agricultural productivity is positive. Excessive use of fertilizer is reduced in agricultural production and appropriate application of fertilizer increases yield per acre. Fertilizer is measured in units 000 N/Tones. The reference sign of this determinant is positive as suggested by the theory.
Agriculture Credit
Most of the farmers in Pakistan are financially weak and do not purchase basic inputs increase their output level such as fertilizer, irrigated water, chemical pesticides, and other machinery, etc. by their own sources. They borrow money from different financial and nonfinancial institutions such as commission agents to purchase these basic agricultural inputs. The easy availability of cheap agricultural credit helps the farmers to apply these inputs in an appropriate way within time and get higher yielding per acre The unit of agricultural credit is estimated in millions of rupees. Agricultural credits are placed in the list of explanatory variables and appear with a positive sign.
Pesticide Consumption
Fabulous benefits have been derived from the use of pesticides in agriculture; Pakistan's economy is largely dependent upon this sector. An increasing trend in productivity is owing to several factors which include the utilization of fertilizer, better varieties of pesticides and use of agriculture machinery. Pesticides have been an essential part of the process by reducing the weeds, diseases and insect pests’ losses which can clearly reduce the amount of harvestable produce. We measure the value of pesticides in million rupees. The expected sign of pesticide use is positive.
Rainfall
Rainfall has a dramatic impact on total agriculture productivity TAP. All crops required a minimum level of water to survive; therefore, rain is the most effective source of watering which is essential for agriculture production. While a regular rainfall pattern is usually very important for healthy plants too much or too little rainfall can be harmful, even though shocking for the crops. Drought is found in the terrorist attack for crops and increase erosion. This variable is an index of average annual rainfall. The average annual rainfall is measured in millimeters. The reference sign will be and connected positive relation with agriculture productivity
Sources of Data and Methodology
The current study investigates the time series data for the study time from 1990-2017. In this study, we used six variables that are total agriculture productivity (TAP), agriculture employment (AEMP), fertilizer consumption (FERC), agriculture credit (ACR), the area under cultivation (AUC), Consumption of pesticides (CP) and rainfall (RF). The data on crop production index, arable land, rainfall, and agriculture employment are taken from WDI of the world bank. Data on fertilizer consumption, pesticide consumption, and agriculture credit are obtained from the various issues of agriculture statistics of Pakistan.
Methodology
We applied a autoregressive distributed lag (ARDL) model which is popularized by Pesaran, et al. (1996) and Pesaran (1997).
Model is followed as:
?TAP?_jt=?_0+?_1 ?AEMP?_t+?_2 ?AUC?_t+??_3 FC?_t+?_4 ACR+??_5 CP?_t+??_6 RF?_t+?_t (1)
TAP = Total Agriculture productivity
AEMP = Agriculture Employment``
AUC = Area under cultivation
FC = Fertilizer consumption
ACR = Agriculture credit
CP = consumption of pesticides
RF = Rainfall
Unit Root Test
The results related to the long run and short run affiliation often depend upon the study period and the econometric procedure applied. In this view, if time series data are used for investigation, several statistical techniques and tests are required. The unit root technique will be applied to every series individually to check the stationarity of the data. Nonstationary data contain unit roots. individual unit root process Augmented Dickey-Fuller (ADF) (1981will be employed. However, ARDL is flexible for integrating the order so that variables which are included in the model can be either stationary at level, the difference once or a mixture of these. Even a single variable cannot be stationary at the 2nd difference. Furthermore, the estimation technique provides efficient results for small samples also.
Autoregressive Distributed Lag Model (ARDL)
An econometric investigation of long-term relationships has been focused on in most empirical and theoretical research in the field of economics. The cases in which the variables in long-run relations of interest are differenced-stationary, the general practice of the model the series as stationary autoregressive distributed-lag (ARDL) technique to get strong results for the long-run relationship. ARDL approach consists of estimating the following equation as
TAP=?_0+?_1 ?TAP?_(jt-1) ?+??_2 AEMP?+??_3 ?AEMP?_(jt-1)+?_4 ?AUC?_jt+?_5 ?AUC?_(jt-1)+?_6 ?FC?_jt+?_7 ?FC?_(jt-1)+??_8 ACR?_jt+??_9 ACR?_(jt-1)+??_10 CP?_jt+??_11 CP?_(jt-1)+??_11 RF?_(jt-1)+??_12 RF?_(jt-1)+?_j (2)
Where ?1 to ?12 are the coefficients of long-run dynamic with previous time period t–1 i There are a number of advantages using this estimation technique. The first one is that an ARDL technique cannot force all variables to be stationary in the same order, and are employed irrespective of whether the regressors are stationary at level or differenced-stationary, or mixture in order. Secondly, this technique is insensitive to the sample size, thus an ARDL approach considering the small sample properties and superior to multivariate cointegration and accurate models for analysis is based on study data. Third, even though some expansionary variables are endogenous, a bounds test provides the information of unbiased long-run estimates and suitable t-ratios as suggested by (Pesaran et al, 2001)
??TAP?_t=a+?_(I=1)^n??????_1 TAP?_(t-1) +?_(I=0)^n?????_2 AEMP?_(t-1) ?+?_(I=0)^n?????_3 AUC?_(t-1) ?+?_(I=0)^n??????_4 FC?_(t-1) +?_(I=0)^n??????_5 ACR?_(t-1) +?_(I=0)^n?????_6 CP?_(t-1) ? ?+?_(I=0)^n???????_7 RF?_(t-1)+? ??_1 TAP?_(t-1)+??_2 AEMP?_(t-1)+?_ ??_3 AUC?_(t-1)+??_4 FC?_(t-1)+??_5 ACR?_(t-1)+??_6 CP?_(t-1)+??_7 RF?_(t-1)+?_jt (3)
The first part of the equation with ?1, ?2 ?_3, ?_(4,) ?_(5,) ?_6and ?_7represents the short-run dynamics of the regression while the parameters ?1, ?2, ?3, ?4 ?5, ?6 & ?7 represents a long-run relationship, the null hypothesis of the model is,
H_(0" " ):?_(1 ) to ?_7 are zero
H_1:all "lambdas are non zero"
The ARDL cointegration technique starts with performing bound analysis for H_(0" " )of no cointegration. As calculated, F-value is compared to their critical value. When F-value exceeds upper bound reject H_(0" " ) anyway order condition of integration of variables is I (0) & I (1) and vice versa
In the 2nd stage, if the long-run relation evidence is found between variables, then the following model of the long run (equation 4) will be estimated as,
TAP=a+?_(I=1)^n???_1 TAP?_(t-1) +?_(I=0)^n???_2 AEMP?_(t-1) +?_(I=0)^n???_3 AUC?_(t-1) +?_(I=0)^n???_4 FC?_(t-1) +?_(I=0)^n???_5 ACR?_(t-1) +?_(I=0)^n???_6 CP?_(t-1) ?_(I=0)^n????_7 RF?_(t-1)+? ?_t (4)
If the existence of long-run relation is found, then in the 3rd stage the ECM requires to be estimated. The results of ECM indicate how quick converge after adjusted the short-run shock towards long-run stability. ECM is estimated by the following equation.
TAP=a+?_(I=1)^n??????_1 TAP?_(t-1) +?_(I=0)^n?????_2 AEMP?_(t-1) ?+?_(I=0)^n?????_3 AUC?_(t-1) ?+?_(I=0)^n??????_4 FC?_(t-1) +?_(I=0)^n??????_5 ACR?_(t-1) +?_(I=0)^n?????_6 CP?_(t-1) ? ?_(I=0)^n???????_7 RF?_(t-1) ?+?ECM?_(t-1)+? ?_t (5)
Where ? is the speed adjustment parameter and ECM is obtained from the estimated co-integration model of Eq. (5).
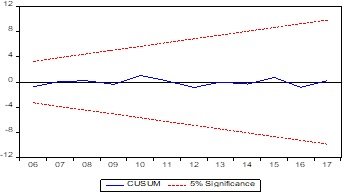
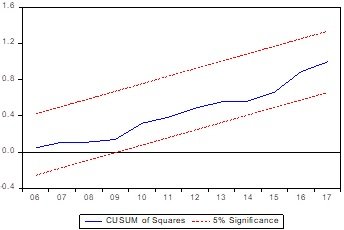
To determine a good fitting ARDL technique, several diagnostic tests and stability tests are performed. These tests check the autocorrelation, purposeful form, normal distribution, and heterogeneity linked with the model. Moreover, the stability of estimation techniques can be examined through CUSUM and CUSUMSQ.
Results
The prerequisite of the ARDL technique, the unit roots to test order of integration the variables through augmented Dickey Fuller. The outcome of this test is placed in Table No.1. Few are stationary at level 1 and few at level, indicate the ARDL is appropriate for analysis.
Table 1. The outcome of Unit Root
|
Variables |
ADF analysis
I(0) |
ADF analysis I(1) |
Integrated order |
|
TAP |
-0.692806
(0.8303) |
-7.096535** ( 0.0000) |
I(1) |
|
AEMP |
-3.805125** ( 0.0078) |
- |
I(o) |
|
AUC |
-4.401451 (
0.0019) |
- |
I(o) |
|
FC |
-5.228378** (0.0003) |
- |
I(0) |
|
ACR |
- |
-4.131997**
( 0.0037) |
I(1) |
|
CP |
- |
-6.049286 ** (0.0000) |
I(1) |
|
RF |
-5.460679 ** (0.0001) |
- |
I(0) |
*, ** & *** show significance at 1 %, 5 %
& 10 % point respectively
Bound Technique
For
the existence of long run relations, in the 2nd stage of the ARDL cointegration
is used to estimate equation (4) and Requirement of F-values by the highest
order of lags to minimize the loss of degrees of freedom(df). The outcome of
Bound Technique is displayed
in TableNo.2.
Table 2.
|
Test statistic |
Value |
Significance level |
Bound Critical
Values* |
|
|
F-statistic |
6.559 |
- |
I(0) |
I(1) |
|
|
|
1% |
2.88 |
3.99 |
|
|
|
5% |
2.27 |
3.28 |
|
|
|
10% |
1.99 |
2.94 |
Authors’ calculation
Note* base on Narayan (2005)
The
computed F value = (6.559) is greater
than the upper bound value (3.28). This implies that the null hypothesis of no
cointegration is rejected at 95% of confidence interval containing the
cointegration relationship among the variables
Table 3. Long Run Results of ARDL Dependent Variable (TAP)
|
variables |
Coefficients |
t-Values |
P-Values |
|
AUC |
9.037399 |
4.479631 |
0.0015 |
|
FC |
0.021891 |
4.433172 |
0.0016 |
|
RF |
1.339101 |
4.777204 |
0.0010 |
|
ACR |
0.000168 |
2.263330 |
0.0499 |
|
AEMP |
1.411024 |
1.498567 |
0.1682 |
|
CP |
0.000766 |
1.532110 |
0.1599 |
|
Constant |
-404.0972 |
-3.634729 |
0.0054 |
Source
author calculation
Table
No 3 represents ARDL (1, 2, 1, 2, 2, 1, 1) model for the long run. The determinant of agriculture productivity
the coefficient of AUC 9.037 is positively and statistically significant. This
show that crucial input is available in an adequate amount and attempt to
cultivate more area raises the TAP growth that one percent increase in arable
land available for cultivation out of total land increase 9 percent agriculture
productivity. Fertilizer is appeared as the main input increasing the
agriculture productivity in Pakistan. The coefficient of rainfall 1.339
significantly & positively affects rainfall and enhances productivity. The
average rainfall rises by one millimeter will increase agricultural
productivity by around 1.339% in the long run.
Agriculture credit is one more
main source of TAP showing a positive coefficient value and significant at 5
percent implying that one million rises in agriculture credit will better the
productivity of agriculture by 0.000168 percent. Which highlights that the
farmers are facing economic problem and credit should be available on time and
low cost which facilitate the farmer to purchase required input? The
consumption of pesticides does not contribute to productivity, because of
unawareness of the small farmers or the side effect of pesticides on human
health. This verifies that pesticide consumption has no long- term significant
effect on the dependent variable
The ECM illustration of the
chosen ARDL model is displayed in Table No.4. Notation (d) before the variable
shows the difference once of that variable, statistics in Table No.4 point out
the short-run coefficient of the area under cultivation is to increase the TAP
by 2.801 percent as compare to long-run coefficient 9.037. One of the key
determinants of agriculture productivity is fertilizer; in short, run TAP with
regard to chemical fertilizer is 0.0122 as compared to its long-run coefficient
of 0.021 confirm the effect of fertilizer on TAP is subject to increasing
returns to scale. The third essential determinant of agricultural productivity
is rainfall the short-run coefficient is 0.234 which increases agriculture
productivity in the short run and long run. Agriculture employment with a
short-run coefficient of -2.342074 with
one lag which implies that labor productivity is decreasing in short-run
by-2.342074 percent which leads the agriculture productivity fall by the same
amount, Agriculture credit appear
negative with coefficient in short-run which implies that decreasing return in
the availability which leads to decline in the productivity. Agriculture credit
will decrease TAP by -0.000117 percent in the short run. While in the long run
it increases the TAP by 0.000168 percent. Finally, the consumption of
pesticides shows the decreasing return in the short term with the negative
coefficient of -0.000437 while in case of the long run it is statically
insignificant. The speed adjustment coefficient appears with minus sign of
-0.829. It indicates the stability of the model. The error from the previous time span is
adjusted in the current time spans which explain faster convergence towards
equilibrium in long-run from short-run shock model. The adjusted R2 is
0.926 verifies the goodness of fit of the model
Table 4. ECM of ARDL (1, 2, 1, 2, 2, 1, 1) with the Dependent Variable “d(TAP)”
|
Regressor |
Coefficient |
t-ratio |
P-values |
|
D(AUC) |
3.315198 |
2.710354 |
0.0240 |
|
D(AUC(-1)) |
2.801592 |
3.238559 |
0.0102 |
|
D(FC) |
0.012288 |
6.311738 |
0.0001 |
|
D(RF) |
0.234865 |
3.781204 |
0.0043 |
|
D(RF(-1)) |
-0.332465 |
-3.745552 |
0.0046 |
|
D(AEMP) |
0.498207 |
1.521877 |
0.1624 |
|
D(AEMP(-1)) |
-2.342074 |
-7.564985 |
0.0000 |
|
D(ACR) |
-0.000117 |
-2.178368 |
0.0573 |
|
D(CP) |
-0.000437 |
-3.678431 |
0.0051 |
|
ECM(-1) |
-0.829821 |
-9.659008 |
0.0000 |
|
R2 |
0.952947 |
Adjusted R-squared |
0.926480 |
Source:
authors’ calculation
Moreover, the stability tests of the model are estimated by employing (CUSUM)and (CUSUMSQ) of the recursive residua. Fig.No1 is (CUSUM) whereas (CUSUMSQ) is displayed in Fig No-2. Both tests are within the five percent critical bounds which verify the stability of regression and the policy recommendation drawn from the regression analysis
Conclusion
In this study we identify the determinants of total agriculture productivity TAP in Pakistan. There are six determinants of total agriculture productivity. The model contains area under cultivation, fertilizer, agriculture credit, agriculture employment, rainfall, and pesticide consumption The study employed an ARDL technique applying time series data for the time span of 1990-2017. The area under cultivation is the essential determinant of agriculture productivity the coefficient of AUC 9.037 is positively and statistically significant. This shows that arable land is a crucial input available for cultivation is enough and an effort to put more area under raises the TAP growth that one percent increase in arable land available for cultivation out of total land increase 9 percent agriculture productivity. Fertilizer appears as the main input increasing the agriculture productivity in Pakistan. The coefficient of FC 0.021 means that fertilizer positively and significantly affects the total agriculture productivity. A one (000N/ton) fertilizer will be applied leading to 0.021 ton raise in agriculture production. The coefficient of rainfall 1.339 significant and the positive affect of rainfall made a significant contribution in enhancement of productivity. This study finds out that a rise in the rainfall on average one millimeter will increase productivity around 1.339% in the long run.
Agriculture credit is one more main source of TAP showing a positive coefficient value and significant at 5 percent implying that one million rises in agriculture credit will better agricultural productivity of with 0.000168 percent. This highlights that the farmers are facing economic problems and credit should be available on time and at low cost which facilitates the farmer to purchase required inputs. Lastly, agricultural employment and pesticide consumption are positive but statistically insignificant. It indicates that indispensable input agricultural labor is not available in sufficient supply because of migration to the urban areas. The consumption of pesticides does not contribute to productivity, because of unawareness of the small farmers or the side effect of pesticides on human health. This verifies that pesticide consumption has no long term significant effect on the dependent variable
The ECM illustration of the chosen ARDL model is that the speed adjustment coefficient appears with a minus sign of -0.829. It indicates the stability of the model. The error from the preceding time span is adjusted in the current time spans which explain faster convergence towards equilibrium in long-run from short-run shock model. The adjusted R2 is 0.926 verifies the goodness of fit .of the model
This empirical evidence indicates that the present study recommendation is to enhance agriculture productivity with high pat off inputs and make sure food security, that government should it ensure on time and available at the lowest cost and easy supply of fertilizer, agriculture credit to small farmers. Furthermore, the cultivation of extra land increases agricultural productivity and total agricultural output.
Moreover the stability tests of the estimated equation by employing (CUSUM) and (CUSUMSQ) of the recursive residual. Both tests are within the five percent critical bounds which verify the regression is stable and policy recommendation can be reliably derived from the model.
References
- Ahmad, K., Chaudhary, M. Aslam, & Ilyas, M. (2008). Trends in total factor productivity in Pakistan agriculture sector. Pakistan Economic & Social Review 46:2 117-132.
- Ahmad, Munir, (2001). Agricultural Productivity Growth Differential in Punjab, Pakistan: A District-Level Analysis. The Pakistan Development Review, 40(1), 1-25.
- Ali, S. (2005). Total factor productivity growth and agricultural research and extension: An empirical analysis for Pakistan's agriculture: 1960-96. Pakistan Development Review. 44(4 Part II), 729-746.
- Azhar, R. A. (1991). Education and technical efficiency during the green revolution in Pakistan. Economic Development & Cultural Change, 39(3), 651-665.
- Bahmani-Oskooee, M. & Bohl, M. (2000). German monetary unification and the stability of German M3 money demand function. Economic Letters, 66, 203-208.
- Brown, R., J. Durbin, & J. Evans (1975). Techniques for testing the constancy of regression relations over time. Journal of the Royal Statistical Society, 37, 149-163.
- Engle, R. & C. Granger (1987). Cointegration and error correction representation: Estimation and testing. Econometrica, 55, 251-276.
- Hussain, S. M. T. and Ishfaq, M. (1997). Dynamics of Agricultural Productivity and Poverty in Pakistan, Centre for Management and Economic Research (CMER) working paper series, working paper, 97(14), 1-21.
- Kiani, A. K., Iqbal, M. & Javed, T. (2008). Total factor productivity and agricultural research relationship: Evidence from crops sub-sector of Pakistan's Punjab. European Journal of Scientific Research, 23(1), 87-97.
- International Research Journal of Finance and Economics - Issue 95 (2012) 172 Pakistan, (Various Issues). Pakistan Economic Survey. Finance Division, Economic Advisor's Wing, Islamabad.
- Parikh, A. & Shah, K. (1994). Measurement of technical efficiency in the north-west frontier province of Pakistan. Journal of Agricultural Economics, 45(1), 132-138.
- Pesaran, M. H., Y. Shin & Smith, R.J. (1996). Testing for the existence of a Long-run relationship. Faculty of Economics, University of Cambridge, Cambridge Working Papers in Economics 9622.
- Pesaran, M. H. & Shin, Y. (1999). An autoregressive distributed lag modeling approach to cointegration analysis. In Storm, S. (eds), Econometrics and Economic Theory in 20th Century: The Ragnar Frisch Centennial Symposium. Cambridge: Cambridge University Press.
- Pesaran, M. H., Y. Shin & R. J. Smith (2001). Bounds testing approaches to the analysis of level relationships. Journal of Applied Econometrics 16: 289-326.
- Sabir, M., & Ahmed, Q.M. (2008). Economic Reforms and Total Factor Productivity Growth in Pakistan: An Empirical Analysis. Business Review, 3(1), 53-68
Cite this article
-
APA : Kakar, M., Kiani, A., & Baig, A. (2016). Determinants of Agricultural Productivity: Empirical Evidence from Pakistan's Economy. Global Economics Review, I(I), 1-12. https://doi.org/10.31703/ger.2016(I-I).01
-
CHICAGO : Kakar, Mehmood, Adiqa Kiani, and Asia Baig. 2016. "Determinants of Agricultural Productivity: Empirical Evidence from Pakistan's Economy." Global Economics Review, I (I): 1-12 doi: 10.31703/ger.2016(I-I).01
-
HARVARD : KAKAR, M., KIANI, A. & BAIG, A. 2016. Determinants of Agricultural Productivity: Empirical Evidence from Pakistan's Economy. Global Economics Review, I, 1-12.
-
MHRA : Kakar, Mehmood, Adiqa Kiani, and Asia Baig. 2016. "Determinants of Agricultural Productivity: Empirical Evidence from Pakistan's Economy." Global Economics Review, I: 1-12
-
MLA : Kakar, Mehmood, Adiqa Kiani, and Asia Baig. "Determinants of Agricultural Productivity: Empirical Evidence from Pakistan's Economy." Global Economics Review, I.I (2016): 1-12 Print.
-
OXFORD : Kakar, Mehmood, Kiani, Adiqa, and Baig, Asia (2016), "Determinants of Agricultural Productivity: Empirical Evidence from Pakistan's Economy", Global Economics Review, I (I), 1-12
-
TURABIAN : Kakar, Mehmood, Adiqa Kiani, and Asia Baig. "Determinants of Agricultural Productivity: Empirical Evidence from Pakistan's Economy." Global Economics Review I, no. I (2016): 1-12. https://doi.org/10.31703/ger.2016(I-I).01