
- To find the effect of IPO events on existing firms, share prices belong to the same industry.
- To analyze the effect of IPO on existing operating performance
- To analyze the effect of IPO on industry concentration.
- How does IPO affects the share price of existing firms that belong to the same industry?
- How do firms already exist in the industry get affected through IPO events?
- How IPO impacts the industry concentration where it’s occurred?
- Akhigbe, A., Borde, S. F., & Whyte, A. M. (2003). Does an industry effect exist for initial public offerings? Financial Review, 38(4), 531-551.
- Akhigbe, A., Johnston, J., & Madura, J. (2006). Long-term industry performance following IPOs. The Quarterly Review of Economics and Finance,46(4), 638-651.
- Baker, M., & Wurgler, J. (2000). The equity share in new issues and aggregate stock returns. The Journal of Finance, 55(5), 2219-2257.
- Braun, M., & Larrain, B. (2009). Do IPOs affect the prices of other stocks? Evidence from emerging markets. Review of Financial Studies, 22(4), 1505-1544.
- Brav, A. (2000). Inference in Long†Horizon Event Studies: A Bayesian Approach with Application to Initial Public Offerings. The Journal of Finance,55(5), 1979-2016.
- Busaba, W. Y., Benveniste, L. M., & Guo, R. J. (2001). The option to withdraw IPOs during the premarket: empirical analysis. Journal of Financial Economics,60(1), 73-102.
- Carr, D. L., Markusen, J. R., & Maskus, K. E. (1998). Estimating the knowledge-capital model of the multinational enterprise (No. w6773). National bureau of economic research. 91(3), 693-708.
- Chan, K., Wang, J., & Wei, K. C. (2004). Underpricing and long-term performance of IPOs in China. Journal of Corporate Finance, 10(3), 409-430.
- Cotei, C., Farhat, J., & Abugri, B. A. (2011). Testing trade-off and pecking order models of capital structure: does legal system matter? Managerial Finance,37(8), 715-735.
- Do more reputable financial institutions reduce earnings management by IPO issuers? (2009, September 1). ScienceDirect.
- Dunbar, C. G., & Foerster, S. R. (2008). Second time lucky? Withdrawn IPOs that return to the market. Journal of Financial Economics, 87(3), 610-635.
- Fama, E. F., & French, K. R. (1993). Common risk factors in the returns on stocks and bonds. Journal of financial economics, 33(1), 3-56.
- Hsu, H. C., Reed, A. V., & Rocholl, J. (2010). The new game in town: Competitive effects of IPOs. The Journal of Finance, 65(2), 495-528.
- Jain, B. A., & Kini, O. (1994). The post†issue operating performance of IPO firms. The journal of finance, 49(5), 1699-1726.
- Jovanovic, B. (2004, February 16). Interest Rates and Initial Public Offerings. NBER.
- Kim, M., & Ritter, J. R. (1999). Valuing IPOs. Journal of financial economics,53(3), 409-437.
- Krishnamurti, C., & Kumar, P. (2002). The initial listing performance of Indian IPOs. Managerial Finance, 28(2), 39-51.
- Lang, L. H., & Stulz, R. (1992). Contagion and competitive intra-industry effects of bankruptcy announcements: An empirical analysis. Journal of Financial Economics, 32(1), 45-60.
- Loughran, T., & Ritter, J. R. (1997). The operating performance of firms conducting seasoned equity offerings. The Journal of Finance, 52(5), 1823-1850.
- Loughran, T., & Ritter, J. R. (2004). Why has IPO underpricing changed over time?. Financial management, 33(3).
- Mikkelson, W. H., Megan Partch, M., & Shah, K. (1997). Ownership and operating performance of companies that go public. Journal of financial economics, 44(3), 281-307.
- Pagano, M., & Panetta, F. (1998). Why do companies go public? An empirical analysis. The Journal of Finance, 53(1), 27-64.
- Pástor, Ľ., Taylor, L. A., & Veronesi, P. (2009). Entrepreneurial learning, the IPO decision, and the post-IPO drop in firm profitability. Review of Financial Studies, 22(8), 3005-3046.
- Ritter, J. R. (1991). The longâ€Ârun performance of initial public offerings. The journal of finance, 46(1), 3-27.
- Sohail, M. K., & Nasr, M. (2007). Performance of initial public offerings in Pakistan. International Review of Business Research Papers, 3(2), 420- 441.
- Sohrabi, M., Biglar, R., & Jamshidian, M. (2013). The relationship between IPOs and long-term industry performance: Evidence from Tehran Stock Exchange. Management Science Letters, 3(11), 2759-2766.
- Spiegel, M., & Tookes, H. (2020). Why does an IPO affect rival firms?. The Review of Financial Studies, 33(7), 3205-3249.
- Stoughton, N. M., Wong, K. P., & Zechner, J. (2001). IPOs and Product Quality. The Journal of Business, 74(3), 375-408.
Abstract:
The present study is conducted to see how an IPO event affects the existing firm's performance within the same industry. For this purpose, 88 IPO firms were examined from Pakistan Stock Exchange (PSX) from 1998-2016. IPO is examined from three major perspectives IPO proceeds, initial returns and time Lag between IPO listing date and IPO subscription. The study uses Buy and Hold Abnormal Returns (BHAR) and Cumulative Abnormal Returns (CAR) to calculate competitor’s abnormal returns. To calculate the operating performance of competitors’, the Wilcoxon significance test was applied. IPO intra-industry effects are significant in the long run, whereas insignificant results are shown in the short run. In addition, IPO proceeds and abnormal returns are significant but negatively related to competitors’ stock returns (long term). Moreover, Herfindahl Hirschman Index (HHI) finds IPO improves competitiveness in the industry environment. This present study is an important one from an emerging economy perspective.
Key Words:
IPO Event, CAR, Time Lag, BHAR, HHI
Introduction
Initial Public Offerings (IPO) is considered an important perspective for any firm as it helps the firm to raise its capital, and it receives much attention from investors, which includes existing and potential investors. There are many research studies that explore the effect of Initial Public Offerings (IPO) on firm operating performance, but there are very few studies that show the effect of IPO on competing firms from the same industry and financial market.
In this study, we gauge the effect of IPO on its competitor’s share prices in the long run and short run. To explain this effect, this study develops hypotheses that IPO have a significant effect on rivals’ stock returns. Why does an IPO affect the stock returns of other firms in the same industry? Rival firms can take the idea from it that the industry has changed its outlook now, and therefore it will create changes in the valuation of competitors. In addition, competitors are compelled to evaluate their competitive position in the industry.
Research Objectives
within the industry.
The remaining paper is structured as follows: Chapter 2 includes a literature review, whereas Chapter 3 includes methodology. Chapter 4 discusses the result and interpretation and Chapter 5 concludes the study followed by the recommendations.
Literature Review
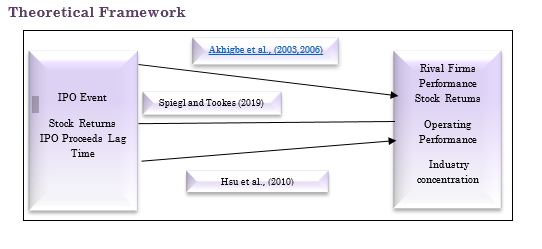
The objective of this study is to explore the effects of IPO events on the operating performance of competitor firms belong to the same industry. According to Akhigbe et al. (2006) and Hsu, Reed and Rocholl (2010), IPO event has a negative effect on rival firms. On the basis of these findings, the first hypothesis of this study is:
Hypothesis 1: IPO stock returns exerts a negative impact on its rival firms stock returns belong to the same industry.
According to Akhigbe et al. (2003), the IPO proceeds collected from the IPO event is to generate a signal for other firms. If a firm considered proceeds from IPO as reimbursement of previous debts and loans, then it will be taken as a competitive advantage from its rivals. Therefore on the basis of this concept, the second hypothesis of this study is:
Hypothesis 2: IPO proceeds negatively impact the performance of prevailing firms belong to similar industries.
The effect of time lag among the date of subscription and trading day of Chinese IPOs have been studied by (Chan, Wang and Wei, 2004) and shown a positive relationship underpricing of IPOs. So we hypothesize that lag time between the subscription date of IPO and its first day of trading of IPO trading creates underpricing and underpricing move towards high abnormal returns which affect rival’s performance.
Hypothesis 3: Time lag between subscription and listing date of IPO significantly affect the operating performance of existing firms’.
Akhigibe et al. (2006) and Hsu et al.,. (2010) both applied Herfindahl Hirschman Index (HHI) to measure industry concentration. The present study also measures how IPO event impacts the industry concentration:
Hypothesis 4: An IPO event significantly impacts its industry concentration.
Operational Definitions
| Variable width="417" valign="top">Definitions | > IPO width="417" valign="top">Initial Public Offering | > Rivals Firm width="417" valign="top">IPO competing firms belong to the same industry | > IPO proceeds width="417" valign="top">The amount against subscription received from IPO investors | > Time Lag width="417" valign="top">A time period between the dates of IPO subscription and listing. | > BHAR width="417" valign="top">Buy and hold abnormal return | > HHI width="417" valign="top">Herfindahl Hirschman Index to measure industry concentration |
Research Methodology
In this study, data is taken from 1998-2016; both years are included. The population of the study consists of 120 IPOs, while 94 IPOs are taken as a sample for this study. This present research uses secondary data collected from Yahoo finance, the Pakistan Stock market etc.
Rival Portfolios Returns in Short-Run
To estimate the effect of IPO on its rival firms, this study used the Cumulative Abnormal Returns (CAR) methodology by Akhigbe et al. (2006).
AR it
Rival Portfolios Returns in Long-Run
To calculate the performance of IPOs on
their rivals, in the long run, this study uses the Buy and Hold Abnormal Returns (BAHR) model.
{(1+Rit) -1}-{(1+Rmt) -1}
Time Lag and Rival Firms Performance
The effect of the time period between the announcement date and first day of trading is studied by (Chan, Wang and Wei,2004) in china and observed a positive relationship underpricing of IPOs. Therefore, on the basis of this concept, this study developed a hypothesis that time lag (lead time) between announcement dates and listing dates results in underpricing of IPO, which is responsible for high abnormal returns.
Results and Interpretation Table 1. Cumulative Abnormal Return- CAR
| Days width="130" nowrap="">IPO width="140" nowrap="">CAR (percentage) width="135" nowrap="">Z-Stats | > 0 width="130" nowrap="">88 width="140" nowrap="">- 0.043 width="135" nowrap="">- 1.591 | > (0, +2) width="130" nowrap="">88 width="140" nowrap="">- 0.012 width="135" nowrap="">- 0.772 | > (0, +6) width="130" nowrap="">88 width="140" nowrap="">0.067 width="135" nowrap="">0.194 | > (0, +10) width="130" nowrap="">88 width="140" nowrap="">0.11 width="135" nowrap="">0.255 | > (0, +14) width="130" nowrap="">88 width="140" nowrap="">0.123 width="135" nowrap="">0.272 |
| Year width="84" nowrap="">n-IPO width="183" nowrap="" colspan="2">BHAR (%) width="186" nowrap="" colspan="2">Tstat | > width="84" nowrap=""> width="78" nowrap=""> IPO width="105" nowrap="">Rival firms width="86" nowrap="">IPO width="100" nowrap="">Rival’s firm | > 1 width="84" nowrap="">88 width="78" nowrap="">-22.34 width="105" nowrap="">-6.67 width="86" nowrap="">-11.68*** width="100" nowrap="">-13.03*** | > 2 width="84" nowrap="">88 width="78" nowrap="">-16.21 width="105" nowrap="">-12.57 width="86" nowrap="">-5.88*** width="100" nowrap="">-4.73*** | > 3 width="84" nowrap="">88 width="78" nowrap="">-8.08 width="105" nowrap="">-7.14 width="86" nowrap="">-4.72*** width="100" nowrap="">-6.77*** | > (1- 3) width="84" nowrap="">88 width="78" nowrap="">-58.01 width="105" nowrap="">54.88 width="86" nowrap="">-3.68*** width="100" nowrap="">-3.02*** |
| Time width="75" nowrap="">ROA width="70" nowrap="">ROE width="80" nowrap="">?Sales width="93" nowrap="">?Assets width="94" nowrap="">Leverage | > width="75" nowrap=""> % width="70" nowrap="">% width="80" nowrap="">% width="93" nowrap="">% width="94" nowrap="">% | > 3 years Pre_IPO width="75" nowrap="">4.2 width="70" nowrap="">8.69 width="80" nowrap="">11.55 width="93" nowrap="">15.57 width="94" nowrap="">12.47 | > 3 years Post_IPO width="75" nowrap="">1.17 width="70" nowrap="">5.34 width="80" nowrap="">7.57 width="93" nowrap="">8.87 width="94" nowrap="">14.57 | > Wilcoxon Sig. width="75" nowrap="">*** width="70" nowrap="">*** width="80" nowrap="">*** width="93" nowrap="">*** width="94" nowrap="">*** |
| width="60" nowrap=""> 1 width="60" nowrap="">2 width="71" nowrap="">3 width="60" nowrap="">4 width="75" nowrap="">6 width="75" nowrap="">7 width="71" nowrap="">8 | > width="60" nowrap=""> AR-1 width="60" nowrap="">AR-5 width="71" nowrap="">AR-10 width="60" nowrap="">AR-20 width="75" nowrap="">AR-365 width="75" nowrap="">AR-730 width="71" nowrap="">AR-1080 | > IR width="60" nowrap="">0.006* width="60" nowrap="">-0.500 width="71" nowrap="">-0.118 width="60" nowrap="">-0.484* width="75" nowrap="">-0.069** width="75" nowrap="">-1.870*** width="71" nowrap="">-0.061** | > width="60" nowrap=""> (1.80) width="60">(0.61) width="71" nowrap="">(0.14) width="60" nowrap="">(1.47) width="75" nowrap="">(2.80) width="75" nowrap="">(5.98) width="71" nowrap="">(1.46) | > IP width="60" nowrap="">0.007* width="60" nowrap="">-3.806* width="71" nowrap="">-0.839 width="60" nowrap="">-2.815* width="75" nowrap="">-0.070*** width="75" nowrap="">-3.830*** width="71" nowrap="">0.08*** | > width="60" nowrap=""> (1.40) width="60" nowrap="">(1.12) width="71" nowrap="">(1.51) width="60" nowrap="">(1.34) width="75" nowrap="">(5.19) width="75" nowrap="">(5.51) width="71" nowrap="">(4.54) | > LT width="60" nowrap="">0.003 width="60" nowrap="">-2.831 width="71" nowrap="">-5.424 width="60" nowrap="">-3.102 width="75" nowrap="">-6.200* width="75" nowrap="">-2.414** width="71" nowrap="">-2.50* | > width="60" nowrap=""> (0.33) width="60" nowrap="">(0.68) width="71" nowrap="">(0.19) width="60" nowrap="">(0.89) width="75" nowrap="">(1.26) width="75" nowrap="">(1.12) width="71" nowrap="">(2.57) | > Adj R2 width="60" nowrap="">0.08 width="60" nowrap="">0.12 width="71" nowrap="">0.04 width="60" nowrap="">0.07 width="75" nowrap="">0.19 width="75" nowrap="">0.41 width="71" nowrap="">0.24 | > N. width="60" nowrap="">88 width="60" nowrap="">88 width="71" nowrap="">88 width="60" nowrap="">88 width="75" nowrap="">88 width="75" nowrap="">88 width="71" nowrap="">88 |
| Mean difference width="118" nowrap="">Std. Err. width="148" nowrap="">Z-Stat width="98" nowrap="">P-Value | > -102.176*** width="118" nowrap="">0.2085 width="148" nowrap="">490.052 width="98" nowrap="">0.0000 |