
- Acemoglu, D. (2008). Oligarchic versus democratic societies. Journal of the European Economic Association, 6(1), 1-44.
- Acemoglu, D., & Robinson, J. A. (2007). On the economic origins of democracy. Daedalus, 136(1), 160-162.
- Alfaro, L., Chanda, A., Kalemli-Ozcan, S., & Sayek, S. (2004). FDI and economic growth: the role of local financial markets. Journal of international economics, 64(1), 89-112.
- Ali, I., & Son, H. H. (2007). Measuring Inclusive Growth. Asian Development Review, Vol. 24 (1), pp.11-31.
- Ali, I., & Zhuang, J. (2007). Inclusive growth toward a prosperous Asia: Policy implications (No. 97). ERD Working Paper Series.
- Anand, R., Mishra, M. S., & Peiris, S. J. (2013). Inclusive growth: Measurement and determinants (No.13-135). International Monetary Fund.
- Baiashvili, T., & Gattini, L. (2020). Impact of FDI on economic growth: The role of country income levels and institutional strength (No. 2020/02). EIB Working Papers.
- Barro, R. J., & Lee, J. W. (2001). International data on educational attainment: updates and implications. oxford Economic papers, 53(3), 541-563.
- Battisti, M., Fioroni, T., & Lavezzi, A. M. (2020). World interest rates and inequality: insight from the Galor-Zeira model. Macroeconomic Dynamics, 24(5), 1042- 1072.
- Ben Naceur, S., & Zhang, R. (2016). Financial development, inequality and poverty: some international evidence.
- Brei M, Ferri G, Gambacorta L (2018) Financial structure and income inequality. CEPR discussion paper 13330
- Busse, M., & Groizard, J. L. (2006). Foreign direct investment, regulations, and growth. The World Bank.
- Cristina, J. U. D. E., & Levieuge, G. (2013). Growth Effect of FDI in Developing Economies: The Role of Institutional Quality (No. 2251). Orleans Economics Laboratory/Laboratoire d'Economie d'Orleans (LEO), University of Orleans.
- Dollar, D., & Kraay, A. (2003). Institutions, trade, and growth. Journal of monetary economics, 50(1),133-162
- Hayat, A. (2019). Foreign direct investments, institutional quality, and economic growth. The Journal of International Trade & Economic Development, 28(5), 561-579.
- Jauch, S., & Watzka, S. (2012). The Effect of Household Debt on Aggregate Demand-The Case of Spain.
- Klasen, S. (2010). Measuring and monitoring inclusive growth: Multiple definitions, open questions, and some constructive proposals.
- Masron, T. A., & Abdullah, H. (2010). Institutional quality as a determinant for FDI inflows: evidence from ASEAN. World Journal of Management, 2(3), 115-128.
- Nawaz, S., Iqbal, N., & Khan, M. A. (2014). The impact of institutional quality on economic growth:Panel evidence. The Pakistan Development Review, 15-31.
- Ngwakwe, C. C., & Dzomonda, O. (2018). Foreign Direct Investment Inflow and Inequality in an Emerging Economy-South Africa. Acta Universitatis Danubius. Ã…Â’conomica, 14(2).
- Nunnenkamp, P., Schweickert, R., & Wiebelt, M. (2007). Distributional effects of FDI: how the interaction of FDI and economic policy affects poor households in Bolivia. Development policy review, 25(4), 429-450
- Papageorgiou, C., Lall, M. S., & Jaumotte, M. F. (2008). Rising Income Inequality: Technology, o L3904r Trade and Financial Globalization? (No. 8-185). International Monetary Fund.
- Savoia, A., Easaw, J., & McKay, A. (2010). Inequality, democracy, and institutions: A critical review of recent research. World Development, 38(2), 142-154.
- Wentworth,L., Schoeman, M. & Langalanga, A., 2015. Foreign Direct Investment and Inclusive Growth in South Arica, Cape Town: University of Cape Town
Abstract:
Countries need a tremendous amount of investment to utilize existing resources and enhance productivity in order to ensure inclusive growth in the economy. Foreign Direct Investment (FDI) by providing the required investment can fulfil the saving-investment gap. The paper makes an empirical investigation of the effectiveness of FDI as a financing tool for inclusive growth. The study also examines how the effectiveness of FDI varies across economies with varying level of institutional quality. The results suggest that FDI plays a significant role in achieving inclusive growth, especially in economies with a low and medium level of institutional Quality. A deep underpinning of our inclusive growth variable brought thoughtful insights such as low and middle-income economies, which mostly belong to the low and medium level of institutional quality cluster. They should adopt policies that enhance the existing spectrum of opportunities. Whereas equity should be the top-most priority for high-income economies.
Key Words:
Inclusive Growth, Institutional Quality, Foreign Direct Investment, Equity
Introduction
Despite the fact that Inclusive growth seems an attractive idea, a huge amount of investments is required to create new opportunities and to utilize the existing capacity of the economy more efficiently. Foreign Direct Investment through financial, technological and knowledge spillovers, can play a vibrant role in filling the gap. It causes structural transformation and mobilizes domestic resources.
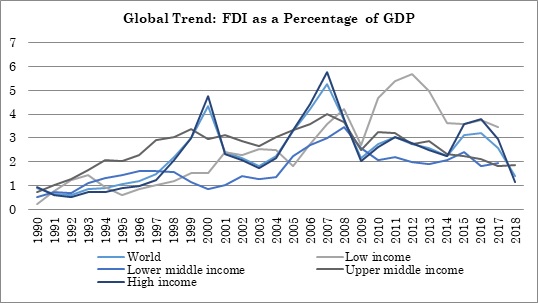
A look at the Global trend of FDI shows that its inflow fell by 23 percent in 2017 to $1.43 trillion from $1.87 trillion in 2016. FDI inflow remained stable in developing economies while it slowed down for developed and for economies in transition. Among the top ten recipients of FDI, half of them are developing economies such as China, Hong Kong, Brazil, Singapore and India. Most of the FDI flew out from the wealthier nation to the developing economies. Their total outflow was $380.8 billion while inflow was about $670.7 billion in 2017. US remained the largest recipient of FDI by receiving 251$ billion, followed by China and Singapore with FDI inflow of $140 billion and $110 billion.
Figure 1: FDI as a Percentage of GDP
FDI is the largest source of external finance, among other sources, possesses the tremendous capability to alter the economic progress of the host economy. FDI in total makes 39% of total incoming finance for developing economies, while its flow is just less than a quarter in the least developed countries (LDC’s).
Considering its contribution and long-term implication, it is a narrow approach to lemmatize the role of FDI in promoting economic growth only. It is evident from economic growth episodes of Great Britain and India that economic growth alone does not guarantee the reduction in poverty or inequality. Recently Indonesia has experienced the worst income inequality in the last 50 years while performing remarkably in terms of economic growth during the financial crisis. This shows that economic growth is a very vague indicator for assessing the development of an economy as it alone cannot ensure the benefit of every segment of society. The new developments in growth literature take poverty and inequality also in the account. Hence the paper links FDI with a broader term, Inclusive Growth. Inclusive growth is a growth process that includes every segment of society. It creates and distributes opportunities in an equitable manner and utilizes a major part of the labour force. It also moves them out of poverty and enhances productive employment. The evidence from a long list of literature, consulted for this research suggest that the resulted effect of FDI on inclusive growth is highly defined by the host economy’s own institutional quality. The empirical investigations in studying the role of institutional quality on attracting FDI’s inflow is extensive. Unfortunately, the existing literature merely focuses on the role of the institution in defining the end effects of FDI.
Keeping the above-mentioned arguments into consideration, this cross-country study aims to meet certain objectives mentioned below:
1- To explore the channels through which FDI can affect inclusive growth.
2- To assess the contribution of foreign direct investment in promoting growth inclusiveness.
3- To explore how variations in the institutional quality change the impact of FDI on inclusive growth.
Literature Review
Foreign Direct Investment in recent years played a very important role in the development of emerging economies. It deals with the two most important issues; lack of capital to initiate any project and lack of expertise to run the project (Marson & Abdullah, 2010). FDI not only affects the economic growth but also has become a source of economic integration. It helped economies in the reduction of poverty and inequality. It directly affects the supply capacity of the public and private sector, generates the employment opportunities and enhances productivity.
FDI can lead to positive spillover effects on the host country by creating employment opportunities, knowledge and technological transfers, and by enhancing competition. In a few studies, it is also termed as “sustainable investment”, which can lead to socio-economic development. (Wentworth Schoeman & Langalanga, 2015) argued that FDI’s spillover effect depends on the absorptive capacity of the host country, governments’ ability and right intervention. Governments can play an important part in engaging and negotiating with the investors to invest in the sectors, which can benefit the economy and citizens in the best way possible. Institutions need to set out rules and regulations that create a transparent, corruption-free business environment. A monitoring and assessment system needs to be worked out, accompanied by a corrective mechanism for non-performance. The study concluded that FDI could be used to achieve inclusive growth under a better institutional environment.
Agreeing with (Wentworth Schoeman & Langalanga, 2015), (Busse & Groizardb, 2006) also found positive welfare effects of FDI under a better regulatory framework and an efficient institutional setting. The same study argues that while an adequate amount of government regulations can lead to a positive effect of FDI, yet and excessive regulations can restrict the growth effect of FDI. Excessive regulations can occur if human and capital resources are prevented from reallocation. It can diminish the ease of doing business and result in restrictive employment laws. In addition to this, multinational firms can reduce forward and backward linkages to the local economy if the government strictly enforces contacts and creditors’ rights to protect investors. In summary, FDI can have a positive or negative effect on the economy’s growth prospects depending on the kind of role institutions’ play. (Hayat, 2019) confirmed the proposition provided the evidence that FDI-led growth was only observable in low-middle income countries. In high-income economies, FDI was found to slow down economic growth even after inducing the role of institutional quality. The paper also found that better quality of institutions can improve FDI led economic growth in low and middle-income economies only. (Nunnenkamp, Schweickert and Wiebelt, 2007) conducted a general equilibrium analysis and analyzed medium to long term impact of FDI inflows on poverty and income distribution in Bolivia. The analysis suggests that FDI inflows contribute to Bolivian economic growth and reduction in poverty. However, the income distribution becomes more unequal more. Specifically, it widened the disparity between urban and rural areas. It leads to more employment and greater factor remuneration in the urban segment while rural segment benefits marginally. Furthermore, they argued that the growth and poverty-reducing effect of FDI is also dependent on the government’s capability in enhancing the absorptive capacity of high FDI inflows. (Alafro et. Al., 2004) argued that underdeveloped local financial institutions can limit a country’s ability to exploit the potential of FDI spillover. (Tamar, Gattini & Luca, 2020) provided evidence that absorptive capacity matters in channelling FDI effects. Countries with better institutional setups show a positive impact of FDI on economic growth. The study concluded that FDI benefits do not accrue mechanically and evenly across economies; instead, there is an endogenous relation between FDI and growth. This endogenous relation can be explained by the role of institutions. This effect gets larger as we move from low to middle-income economies; however, it diminishes as we move from transition to developed economies.
The above-discussed glimpse of the literature suggests that despite the role of FDI in achieving growth has been acknowledged in a decent amount of literature, yet its role in promoting growth inclusiveness lacks emphasis. Furthermore, to the best of our understanding, the role of institutional quality has not been embedded in empirical researches while studying this FDI, inclusive growth nexus on such an extensive level. The study contributes to the existing set of knowledge by investigating the Link between FDI and inclusive growth. It also assesses the role of institutional quality in order to determine the effectiveness or ineffectiveness of FDI as a driver of inclusive growth.
Methodology and Data Sources
Measuring Inclusive Growth
In literature, inclusive growth is defined as the maximization of the social opportunity function. As it undertakes the spectrum of efficiency and equity under one umbrella. The concept of social opportunity function itself was derived from the idea of generalized concentration curve introduced initially by (Ali & Son, 2007) in inclusive growth literature. This concept of generalized concentration curve was later used to form social opportunity index by calculating the area under the curve (Anand, Mishra, and Peiris, 2013).
Y^*=?_0^100?Y ? _(i ) d_i……………………………. (1)
Considering the fact that opportunity can take any forms such as health care, education or several other monetary and non-monetary opportunities. The study will use Income as a determinant of opportunity. As it is the most common and widely used measure of determining individuals’ access to certain other kinds of opportunities.
Following points can be understood by the above equation (1).
For a completely equitable societyY ? = Y ?*.
If Y ?* < Y ? , it suggests the inequitable distribution of income.
A higherY ?*depicts higher level of income.
Y ? Shows the average opportunities available to any society. While, Y ?*shows average availability of opportunities to individuals belonging to each income quintile. Hence, the deviation betweenY ?* and Y ?shows inequality in distribution of the opportunities (which in our case is interpreted by income). Based on this empirical modelling, (Ali and Son, 2007) proposed Income Equity index (IEI),
?_(i )=(Y ?*)/Y ?
A completely equitable society will be having the (IEI) ?_(i )=1, Inclusive growth can be achieved by increasing ?Y and by increasing the value of equity index?(??_(i )). Where,
Y ?*= ?* Y ?……………………(2)
Equation-2 defines that inclusive growth depends on average income and distribution of the income across different segments of society.
Dy ?*= ?_(i )* dy ? + d?_(i )* y ?………..(3)
dy ?* is the change in degree of inclusive growth, growth is more inclusive if dy ?*>0. Equation -3 suggests that we can adopt two kinds of policy measures: i) which increases the average income (growth-oriented policies) ii) which makes the distribution of the resources or opportunities more equitable, several interpretations of inclusive growth can be deduced from the above equation (Klasen, 2010)
dy ?> 0 and d? > 0 – growth is unambiguously inclusive
dy ?< 0 and d? < 0– growth is unambiguously non-inclusive
dy ?> 0 and d? < 0- can be inclusive (if the percentage change in average opportunities is greater than the percentage change in ?)
dy ?< 0 and d? < 0- can be inclusive if the percentage change in ? is greater than the percentage change in average opportunities.
The above discussed theoretical model provided us with the basis for the calculation of inclusive growth, which works as the key variable for this study. In the present study we have taken Per Capita Gross Domestic Product as the average opportunity available in the society (Y ?), for (Y ?*) we have taken income share held at different income quintile.
Measuring Institutional Quality Index
In order to construct the institutional quality index, we applied Principal Component Analysis (PCA) on World Governance Indicators by the World Bank (voice and accountability, government effectiveness, control of corruption, regulatory quality, the rule of law and political stability and violence) (Nawaz, Iqbal & Khan, 2014). Each indicator ranges from - 2.5 to + 2.5. It is expected that the variables will be correlated; hence we applied principal component method (PCM). PCM converts each possibly correlated variable into linearly correlated variables called principal component by using orthogonal transformation. Each principal component explains the amount of variation exists within a certain variable under Principal Component Method (PCM). Generally speaking, PCA converts a large number of correlated variables to a smaller number of uncorrelated variables. Another advantage of using PCA is that the weights to be assigned with each indicator are determined by data itself which mitigates the biasness created by any objective weight assigning technique. In our case, most of the variation was explained by the first component; hence its value has been used to compute the index (See Annexure-B).
Regression Framework
As discussed in section two, the study specifically investigates the use of FDI as a tool of financing inclusive growth while incorporating the role of institutional quality. In order to do so, the following model is estimated.
?Y^*?_(i,t)-Y^*i,t-1=?i + ?t+?_1 log?FDI?_(,i,t)+?2 IQIi,t + ?3Xi,t ?+u?_it…(4)
GDPit=?i + ?t+?_1 log?FDI?_(,i,t)+?2 IQIi,t + ?3Xi,t ?+u?_it…(5)
?Y^*?_(i,t)-Y^*i,t-1 is inclusive growth already measured and calculated using social opportunity function used by (Ali and Son, 2007). FDIit is the inflow of foreign direct investment as a percentage of GDP. Here, if ?1 is <0 it means Inclusive growth will decrease with the higher level of FDI and conversely, ?1>0 suggests that higher level of FDI will increase inclusive growth. IQIit is institutional quality index calculated using principal component analysis. Xit, is the set of control variables which are introduced in order to determine the strength of the relationship in more effective manner. The related reviewed literature helped in choosing the control variables which include; Domestic credit to the private sector as a percentage of GDP proxy for financial deepening, trade openness measured by merchandise trade as a percentage of GDP, the government fixed capital formation as a determinant of fixed investment, government consumption expenditure as a percentage of GDP, Inflation as a proxy for economic stability and dependency ratio. Ui represents a country and time-specific effect where i represents country and t represents time. In regression (3.3.2) we have used gross domestic product (GDP) as our dependent variable. It will help us to compare the extent to which the effectiveness of different policy variables varies for inclusive growth and economic growth.
As discussed in the section, 3.1 inclusive growth depends on i) Average opportunities availability (Y ?) and ii) how the opportunities are distributed measured by equity index (?_ ). As the next step, the research will disaggregate the inclusive growth variable and analyze the impact of FDI on two components of inclusive growth.
Y ?it=?i + ?t+?_1 log?FDI?_(,i,t)+?2 IQIi,t + ?3Xi,t ?+u?_it…(6)
?_(it )= ?i + ?t+?_1 log?FDI?_(,i,t)+?2 IQIi,t + ?3Xi,t ?+u?_it…(7)
This part of the estimation will help us to assess that under different levels of institutional quality which kind of policy as a short term policy tool a country must adopt.
Data Sources
The study uses panel data of 86 world economies, selection of time series and cross-sectional units are majorly interpreted by the availability of data. The data related to income share held at each quintile is scattered and an unbalanced database. In addition, the worldwide governance indicators (WGI) database for construction of the institutional quality index is only available since 1996. The data has been divided into three main clusters according to their ranking and performance in terms of their institutional quality. Economies with an average IQI value of (< 0) were classified as low in institutional quality, an average value of IQI (> 0<1) were categorized in medium, and an average value of (IQI >1) were considered as economies with high level of institutional quality.
We introduced inclusive growth as our dependent variable; the data for the said variable was also constructed using social opportunity function (Ali & Son, 2007; Zhuang & Juzhong, 2007; Anand & Misra, 2013) the detailed description and methodology of constructing the inclusive growth variable is mentioned in section 3.1. The data for Per-capita income and income share have been taken from the World Bank. Income share at each 20% has been multiplied by per-capita income and divided by the population share (Anand & Misra, 2013). Our inclusive growth variable is designed in such a way that it gives high weightage to any transfer or creation of opportunities for the lower-income segment and low weightage if the opportunity is transferred or created for the upper-income segment of the society.
The data for control variables have been collected from different international institutions such as; data for trade openness and FDI have been obtained from world trade organization; Government consumption expenditure data as a percentage of GDP and Government fixed capital formation as a percentage of GDP from the World Bank national accounts data, data for inflation measured by consumer price index and domestic credit to private sector comes from international financial statistics compiled by international monetary fund and data for age dependency ratio from the world bank estimates of United Nations’ population division data.
Results and Discussion
The results presented in Table -1 are fixed effect robust estimates, which automatically addresses any underlying existence of heteroscedasticity. Hausman specification test has been used to select between the two widely used panel estimation techniques, fixed and random effect estimation. Result for the overall sample of world economies shows a significant positive effect of FDI on inclusive growth and GDP. The second key variable, institutional quality, has shown a significant effect on overall economic growth and failed to show any significant impact on growth inclusiveness. The categorization of data on the basis of institutional quality will help us to have a deep insight into this negative yet insignificant association. The results show that fixed investment and trade openness both contribute not only in boosting economic growth but also help in making the growth process more inclusive. Financial deepening confirming a few recent researches failed to show any positive impact (Naceur and Zhang, 2016; Battisti et al. 2018; Brei et al. 2018). The effect of inflation and dependency ratio remained negative.
The main aim of the study is to analyze the role of FDI in financing the inclusive growth process under different levels of institutional quality. In order to do so, we have divided data into three different institutional regimes low, medium and high level of institutional quality based on different levels of an institutional quality index for 86 countries for the period of 1996 to 2015. This categorization of the economies on the basis of varying level of institutional quality will help us to understand the dynamics of the relation between FDI and Inclusive growth in a more elaborate manner.
Low Institutional Quality Cluster
The fixed effect estimates for low institutional quality cluster suggests a positive and significant association between FDI and inclusive growth with a coefficient of (0.029). The results obtained suggest that FDI positively affect the economic growth variable. The positive association comply with the results for inclusive growth too. However, the coefficients for them vary immensely. The coefficient of FDI from the first model is 0.029,, while the coefficient for the second model is 1.550. The difference between the two suggests that there is a huge gap in policies. As FDI’s contribution to promoting economic growth is significantly larger than for inclusive growth.
The first cluster contains the economies having an average value of less than zero of the institutional quality index. Here, the negative sign of IQI affirms the fact that an increase in the level of institutional quality alone cannot guarantee the improvement in an overall economic situation unless a threshold level has been achieved (Jude & Levieuge, 2013). Similar to this, GDP and institutional quality is having a significant negative association. This suggests that persistent and lower level of institutional quality creates an overall lower level of economic achievements.
Control variables government fixed investment and trade openness depicted a positive association with inclusive growth, as they broaden the size of the available opportunities resulting in an expansion of average opportunities availability (Ali & Son, 2007; Barro & Lee, 2000; Dollar & Kraay, 2003; Anand & Misra, 2013). Interestingly, financial deepening measured by a credit to the private sector as a percentage of GDP seems to have a negative impact on inclusive growth confirming (Ali & Son, 2007; Anand & Misra, 2013) as financial development is linked to higher inequality. (Jaumotte, Lall and Papageorgiou, 2008) empirically investigated the relationship between financial deepening and inequality. They explored that a one standard deviation increase in financial deepening from its mean level will increase inequality by 2.6 percent. As financial deepening may disproportionately accrue to the upper-income segment having more income or collateral (Jauch & Watzka, 2012). This negative correlation is also evident in terms of economic growth depicted by GDP growth. There are many empirical pieces of evidence which affirm that there is no significant short term relationship between financial deepening and GDP. Furthermore, inflation and dependency ratio depicts a negative impact on inclusive growth. The results for control variables of our economic growth regression followed the similar signs obtained for inclusive growth regression except for dependency ratio. Coefficients for fixed investment (0.0486) and openness (0.060) showed a positive impact on GDP while coefficients for inflation (-0.104) and dependency ratio with (-0.0049) has shown a negative association with GDP.
Medium Level of Institutional Quality Cluster
The panel regression for unique measure of inclusive growth brought some thoughtful insights for FDI led inclusive growth relation. Foreign direct investment has a positive and significant effect on inclusive growth with a coefficient of (0.0129). Here the interesting point is that the coefficient of FDI for the lower institutional quality cluster was (0.029), which shows that FDI is more helpful in economies with the lower institutional quality cluster. Most of the economies from low level of the institutional quality cluster also belong to low and lower income economies. Hence, any addition in average opportunity availability will tend to increase the inclusive growth more as compared to countries having a higher level of the initial endowment. Due to this, the impact of FDI can be seen for countries with mid-level of institutional quality on inclusive growth is less. Furthermore, the effect of FDI on overall economic growth is much larger in extent as compared to inclusive growth.
Here, institutional quality is seen to play a significant role in the inclusive growth process with a coefficient of (0.058). This shows that an improved level of institutional quality helps economies to distribute the resources in more equitable manner. Similarly, the impact of institutional quality on GDP is positive and significant. Trade openness and fixed investment has shown a significant and positive relation with IG and GDP. The effect of said variables are slightly more pronounced in our second regression.
Cluster with High Level of Institutional Quality
The results for this cluster highlight some interesting insights for our study. Initially
our coefficient for FDI showed a positive yet an insignificant impact on our both inclusive growth and GDP growth variables. Here a notable point is that all the economies in this cluster belong to high income economies category. Hence, this insignificant association might come from the fact that as countries attain a certain level of resources, no more foreign inflow or finances can be helpful in defining their growth inclusiveness. Furthermore, FDI led growth is usually more evident in low and middle income countries whereas, in high income economies FDI tends to slow down the economic growth or have no long term effect (Hayat, 2019).
Our coefficient for institutional quality index shows a positive and significant impact on inclusive growth. The effect for this cluster is larger as compared to the coefficients obtained for the previous two clusters. This shows that economies with higher level of institutional quality are more likely to design and implement policies of equitable distribution of resources. Here, fixed investment seems to have a negative impact on inclusive growth contrasting the previous results. This signifies that the resulted opportunities by government fixed capital formation are less inclusive in high income economies. Trade openness complying with the previous clusters has shown a positive association, while the effect of financial deepening remained negative for our inclusive growth variable. Results obtained for our economic growth regression suggest that institutional quality plays a vital role in overall economic growth for economies with high level of institutional quality. As good quality institutions strengthen the trust of domestic and foreign investors and bring economic prosperity. Here, fixed investment and trade openness plays more important role in GDP growth as compared to inclusive growth. The above-mentioned results explain the significance of using FDI for a broader perspective which is inclusive growth. This conclusion itself is not sufficient to develop policies for inclusive growth. For the deeper understanding of FDI and inclusive growth relation, we broke down the components of inclusive growth variable and regressed them individually on the similar set of exogenous and control variable.
Table 1: A Comparative Analysis of FDI led Inclusive Growth vs. FDI led Economic Growth
| Fixed effect Robust Estimates width="163" colspan="2">Overall width="171" colspan="2">Low Institutional Quality Cluster width="169" colspan="2">Medium Institutional Quality Cluster width="170" colspan="2">High Institutional Quality Cluster | > Inclusive Growth width="79">GDP width="85">Inclusive Growth width="86">GDP width="85">Inclusive Growth width="84">GDP width="82">Inclusive Growth width="88">GDP | > Log FDI width="84">0.0147* width="79">0.8648* width="85">0.0288* width="86">1.4610* width="85">0.0129* width="84">0.6855 width="82">0.0012 width="88">0.2840 | > width="84"> (0.00) width="79">(0.00) width="85">(0.00) width="86">(0.00) width="85">(0.00) width="84">(0.01)* width="82">(0.79) width="88">(0.32) | > Institutional Quality Index width="84">0.0151 width="79">1.4991*** width="85">-0.0216 width="86">-.2617** width="85">0.0588* width="84">1.2799 width="82">0.0678*** width="88">3.0407** | > width="84"> (0.29) width="79">(0.08) width="85">(0.35) width="86">(0.03) width="85">(0.00) width="84">(0.01)* width="82">(0.08) width="88">(0.03) | > Govt. Cons. Exp. width="84">-0.0120* width="79">0.0805 width="85">-0.0020 width="86">0.1774** width="85">0.0010 width="84">-0.0755 width="82">-0.0507* width="88">0.2409** | > width="84"> (0.00) width="79">(0.46) width="85">(0.51) width="86">(0.03) width="85">(0.74) width="84">(0.59) width="82">(0.00) width="88">(0.04) | > Fixed Investment width="84">0.0009* width="79">0.0979* width="85">0.0009* width="86">0.0486* width="85">0.0008** width="84">0.0740 width="82">-0.0011 width="88">0.1424* | > width="84"> (0.00) width="79">(0.00) width="85">(0.00) width="86">(0.00) width="85">(0.02) width="84">(0.00) * width="82">(0.23) width="88">(0.00) | > trade openness width="84">0.0007* width="79">0.1169* width="85">0.0012*** width="86">0.0600* width="85">0.0005 width="84">0.0303* width="82">0.0016*** width="88">0.1854* | > width="84"> (0.00) width="79">(0.00) width="85">(0.06) width="86">(0.06) width="85">(0.13) width="84">(0.00) width="82">(0.09) width="88">(0.00) | > financial deepening width="84">-0.0010* width="79">-0.0593* width="85">-0.0016** width="86">-0.0775* width="85">-0.0008 width="84">-0.0520* width="82">-0.0002 width="88">-0.0406*** | > width="84"> (0.00) width="79">(0.01) width="85">(0.00) width="86">(0.00) width="85">(0.00) width="84">(0.00) width="82">(0.32) width="88">(0.06) | > Inflation width="84">-0.000633 width="79">-0.0750*** width="85">-0.0012 width="86">-0.1036* width="85">0.0024 width="84">0.0270 width="82">-0.0074 width="88">-0.0129 | > width="84"> (0.23) width="79">(0.07) width="85">(0.11) width="86">(0.00) width="85">(0.17) width="84">(0.74) width="82">(0.31) width="88">(0.93) | > Dependency Ratio width="84">-0.0003 width="79">0.030 width="85">0.0009 width="86">-0.0049 width="85">-0.0044* width="84">-0.0595 width="82">0.0049** width="88">0.0073 | > width="84"> (0.69) width="79">(0.64) width="85">(0.55) width="86">(0.93) width="85">(0.01) width="84">(0.30) width="82">(0.02) width="88">(0.94) | > Constant width="84">0.2089* width="79">-1.3662 width="85">0.0472 width="86">5.7017 width="85">0.0044 width="84">2.8499 width="82">0.4199*** width="88">-12.2895 | > width="84"> (0.00) width="79">(0.85) width="85">(0.71) width="86">(0.32) width="85">(0.95) width="84">(0.52) width="82">(0.07) width="88">(0.26) | > R-Squared Within width="84">0.1959 width="79">0.2315 width="85">0.2134 width="86">0.27 width="85">0.3344 width="84">0.3596 width="82">0.6559 width="88">0.3728 | > R-Squared overall width="84">0.0744 width="79">0.1589 width="85">0.0217 width="86">0.1506 width="85">0.0652 width="84">0.2206 width="82">0.1087 width="88">0.1722 | > No. of observation width="84">682 width="79">750 width="85">331 width="86">366 width="85">208 width="84">227 width="82">142 width="88">156 | > No. of groups width="84">81 width="79">84 width="85">43 width="86">46 width="85">22 width="84">22 width="82">16 width="88">16 | > F-test width="84">F(80, 593) = 3.61 width="79">F(83, 658) =2.55 width="85">F(42, 280) = 5.40 width="86">F(45, 312) =3.00 width="85">F(21, 178) = 2.57 width="84">F(21, 197) =2.48 width="82">F(15, 118) =12.61 width="88">F(15, 132) =1.13 |
| Fixed Effect Estimates width="181" colspan="2">Overall width="162" colspan="2">Low Institutional Quality align="center">Cluster width="161" colspan="2">Medium Institutional Quality Cluster width="163" colspan="2">High Institutional QualityCluster | > Change in Equity Index>(1) width="91">Growth in average Income>(2) width="84">Change in Equity Index>(3) width="78">Growth in average Income>(4) width="77">Change in Equity Index>(5) width="84">Growth in average Income>(6) width="78">Change in Equity Index>(7) width="85">Growth in average Income>(8) | > Log FDI width="91">-0.00157*** width="91">0.01299*** width="84">-0.0058*** width="78">0.0612* width="77">-0.0007 width="84">0.0123** width="78">-0.0001 width="85">0.0152 | > width="91"> (0.06) width="91">(0.07) width="84">(0.08) width="78">(0.00) width="77">(0.45) width="84">(0.03) width="78">(0.92) width="85">(0.16) | > Institutional Quality Index width="91">0.01267* width="91">0.10295 width="84">-0.0073 width="78">-0.0924 width="77">0.0257** width="84">-0.1011** width="78">-0.0432* width="85">0.9295* | > width="91"> (0.00) width="91">(0.29) width="84">(0.77) width="78">(0.36) width="77">(0.02) width="84">(0.03) width="78">(0.05) width="85">(0.00) | > Govt, Consump. Exp width="91">0.00029 width="91">-0.00392 width="84">0.0019** width="78">0.0223* width="77">-0.0007 width="84">-0.0040 width="78">-0.0005 width="85">-0.0037 | > width="91"> (0.64) width="91">(0.46) width="84">(0.03) width="78">(0.00) width="77">(0.38) width="84">(0.55) width="78">(0.20) width="85">(0.71) | > Fixed Investment width="91">-0.00007 width="91">0.00011 width="84">0.0001 width="78">0.0013** width="77">0.0000 width="84">0.0006 width="78">-0.0001 width="85">0.0022* | > width="91"> (0.25) width="91">(0.84) width="84">(0.25) width="78">(0.05) width="77">(0.61) width="84">(0.23) width="78">(0.35) width="85">(0.01) | > Inflation width="91">-0.00011 width="91">0.00179* width="84">-0.0001 width="78">-0.0033* width="77">0.0016* width="84">0.0111* width="78">-0.0015* width="85">-0.0001 | > width="91"> (0.12) width="91">(0.00) width="84">(0.43) width="78">(0.00) width="77">(0.00) width="84">(0.01) width="78">(0.00) width="85">(0.99) | > financial deepening width="91">-0.00008*** width="91">-0.00087* width="84">0.0001 width="78">-0.0057 width="77">-0.0001*** width="84">-0.0024* width="78">0.000005 width="85">-0.0017** | > width="91"> (0.07) width="91">(0.02) width="84">(0.71) width="78">(0.92) width="77">(0.08) width="84">(0.00) width="78">(0.91) width="85">(0.05) | > Dependency Ratio width="91">0.00011 width="91">-0.00006 width="84">-0.0023* width="78">0.0004 width="77">-0.0015*** width="84">-0.0188* width="78">-0.0086* width="85">-0.0189* | > width="91"> (0.42) width="91">(0.95) width="84">(0.00) width="78">(0.89) width="77">(0.08) width="84">(0.00) width="78">(0.01) width="85">(0.00) | > trade openness width="91">-0.00394* width="91">-0.00131 width="84">-0.0004 width="78">0.0073* width="77">0.0002* width="84">0.0001 width="78">0.0002* width="85">0.0020 | > width="91"> (0.00) width="91">(0.62) width="84">(0.09) width="78">(0.00) width="77">(0.00) width="84">(0.90) width="78">(0.07) width="85">(0.11) | > Constant width="91">-0.97451 width="91">0.11234** width="84">-1.0243* width="78">-0.4795** width="77">-1.0892* width="84">1.5252* width="78">-0.9826* width="85">-0.2877 | > width="91"> (0.62) width="91">0.03 width="84">0.00 width="78">(0.07) width="77">(0.00) width="84">(0.00) width="78">(0.00) width="85">(0.39) | > R-Squared Within width="91">0.3284 width="91">0.3154 width="84">0.2326 width="78">0.4607 width="77">0.2237 width="84">0.3305 width="78">0.1211 width="85">0.2642 | > R-Squared overall width="91">0.4246 width="91">0.6414 width="84">0.0031 width="78">0.1196 width="77">0.2053 width="84">0.1291 width="78">0.009 width="85">0.0606 | > F-test width="91">F(56, 474) =157.65 width="91">F(56, 474) =2.80 width="84">F(45, 310) = 941.53 width="78">F(45,311) =25.16 width="77">F(21, 197) =152.88 width="84">F(21, 197) = 50.66 width="78">F(15,132)= 123.48 width="85">F(15, 133) =76.55 |
| Low Institutional Quality Cluster width="89">Medium Level of Institutional Quality width="96">High Level of Institutional Quality Cluster >
| > Argentina width="89">HI width="96">Vietnam width="38">LMI width="60">Belgium width="38">HI width="76">Austria width="29">HI | > Australia width="89">HI width="96">Zambia width="38">LMI width="60">Cyprus width="38">HI width="76">Canada width="29">HI | > Croatia width="89">HI width="96">Albania width="38">UMI width="60">Czech Republic width="38">HI width="76">Chile width="29">HI | > Burkina Faso width="89">LI width="96">Armenia width="38">UMI width="60">France width="38">HI width="76">Denmark width="29">HI | > Ethiopia width="89">LI width="96">Azerbaijan width="38">UMI width="60">Greece width="38">HI width="76">Estonia width="29">HI | > Guinea width="89">LI width="96">Belarus width="38">UMI width="60">Hungary width="38">HI width="76">Finland width="29">HI | > Madagascar width="89">LI width="96">Botswana width="38">UMI width="60">Israel width="38">HI width="76">Germany width="29">HI | > Niger width="89">LI width="96">Brazil width="38">UMI width="60">Italy width="38">HI width="76">Iceland width="29">HI | > Senegal width="89">LI width="96">Colombia width="38">UMI width="60">Latvia width="38">HI width="76">Ireland width="29">HI | > Uganda width="89">LI width="96">Dominican Republic width="38">UMI width="60">Lithuania width="38">HI width="76">Luxembourg width="29">HI | > Bangladesh width="89">LMI width="96">Ecuador width="38">UMI width="60">Malta width="38">HI width="76">Netherlands width="29">HI | > Bolivia width="89">LMI width="96">Iran, Islamic Rep. width="38">UMI width="60">Poland width="38">HI width="76">Norway width="29">HI | > Côte d'Ivoire width="89">LMI width="96">Jamaica width="38">UMI width="60">Portugal width="38">HI width="76">Sweden width="29">HI | > Egypt, Arab Rep. width="89">LMI width="96">Jordan width="38">UMI width="60">Slovak Republic width="38">HI width="76">Switzerland width="29">HI | > El Salvador width="89">LMI width="96">Kazakhstan width="38">UMI width="60">Slovenia width="38">HI width="76">United Kingdom width="29">HI | > Honduras width="89">LMI width="96">Mexico width="38">UMI width="60">Uruguay width="38">HI width="76">United States width="29">HI | > Moldova width="89">LMI width="96">Paraguay width="38">UMI width="60">Bulgaria width="38">UMI width="76">width="29">
| > Mongolia width="89">LMI width="96">Peru width="38">UMI width="60">Costa Rica width="38">UMI width="76">width="29">
| > Nicaragua width="89">LMI width="96">Romania width="38">UMI width="60">Malaysia width="38">UMI width="76">width="29">
| > Pakistan width="89">LMI width="96">Russian Federation width="38">UMI width="60">Panama width="38">UMI width="76">width="29">
| > Philippines width="89">LMI width="96">Serbia width="38">UMI width="60">South Africa width="38">UMI width="76">width="29">
| > Sri Lanka width="89">LMI width="96">Thailand width="38">UMI width="60">Spain width="38">UMI width="76">width="29">
| > Tunisia width="89">LMI width="96">Turkey width="38">UMI width="60">width="38"> width="76"> width="29">
| > Ukraine width="89">LMI width="96">Venezuela, RB width="38">UMI width="60">width="38"> width="76"> width="29">
|
Note: Here LI stands for Low income countries, HI for high income countries, LMI for lower middle income countries and UMI for upper middle income countries following the World Bank’s country classification based on GNI per capita.
References
Cite this article
-
APA : Munir, M., & Fatima, A. (2020). Financing Inclusive Growth through FDI: Incorporating the Role of Institutional Quality. Global Economics Review, V(II), 29-46. https://doi.org/10.31703/ger.2020(V-II).03
-
CHICAGO : Munir, Muneza, and Ambreen Fatima. 2020. "Financing Inclusive Growth through FDI: Incorporating the Role of Institutional Quality." Global Economics Review, V (II): 29-46 doi: 10.31703/ger.2020(V-II).03
-
HARVARD : MUNIR, M. & FATIMA, A. 2020. Financing Inclusive Growth through FDI: Incorporating the Role of Institutional Quality. Global Economics Review, V, 29-46.
-
MHRA : Munir, Muneza, and Ambreen Fatima. 2020. "Financing Inclusive Growth through FDI: Incorporating the Role of Institutional Quality." Global Economics Review, V: 29-46
-
MLA : Munir, Muneza, and Ambreen Fatima. "Financing Inclusive Growth through FDI: Incorporating the Role of Institutional Quality." Global Economics Review, V.II (2020): 29-46 Print.
-
OXFORD : Munir, Muneza and Fatima, Ambreen (2020), "Financing Inclusive Growth through FDI: Incorporating the Role of Institutional Quality", Global Economics Review, V (II), 29-46
-
TURABIAN : Munir, Muneza, and Ambreen Fatima. "Financing Inclusive Growth through FDI: Incorporating the Role of Institutional Quality." Global Economics Review V, no. II (2020): 29-46. https://doi.org/10.31703/ger.2020(V-II).03