
Abstract:
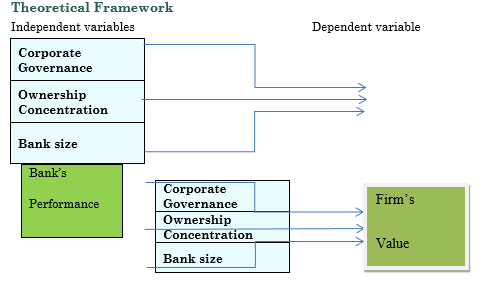
This empirical study examines the impact of corporate governance, ownership structure and bank size on the bank’s performance and firm’s value of the banking sector in Pakistan. The data is extracted for 17 commercial banks listed at the Pakistan Stock Exchange for the period of 2006-2016. The results show that corporate governance and bank size positively affect bank’s performance while ownership concentration does not have any effect on bank’s performance. Moreover, firm’s value is positively affected by ownership concentration, while it is not affected by corporate governance and bank size.
Key Words:
Corporate Governance, Ownership Concentration, Bank Size, Bank’s
Performance, Firm’s Value
Introduction
The main role of the banking system in economy is to develop and facilitate businesses. Therefore, the banking sectors become the most important part of the business development because they are playing a vital role of the agent. The bank will be success when they are playing standard role and also increasing the performance of the banks and the company value. When company share price is high that shows high value of the company and has a strong investor attraction.
Perry (1993) states that the value of the firm is significantly driven by firm performance. The high performance, high and stable share price of banks can be achieved through the implementation of the corporate governance in true meaning. The other variables affecting the bank’s performance and the firm’s value are concentrated ownership and bank size.
The SECP codes (2002) include reforming board of directors for the purpose to make disclosure and should be accountable to shareholders. In fact, a bank is performing the main role of financing in the economy; therefore, banks are more compatible in adopting corporate governance practices for a good transparency, disclosure and accountability (Cornwall, 2007).
Shareholding by management (insider) gives a helpful and major effect on the return on equity (ROE) (Murali, 1989). According to Husnan (2001), concentrated ownership has positive effect on ROE and according to Sugiharto (2007), concentrated ownership has no significant influence on performance (ROE) of banks.
Based on the above discussion, a research needs to be conducted to find out the effect of corporate governance, concentrated ownership and bank size on firm’s value and bank’s performance in the unique context of Pakistani commercial banks.
Literature Review Corporate Governance
Adams and Mehran (2003) argue that the corporate governance as an instrument through which the shareholder can manage the management of the firm and to protect their interest. The corporate governance is a technique through which we can monitor the management of the organization. Corporate governance may also be defined as the set of procedures and laws used to regulate and control business operations. Corporate governance helps in increasing the efficiency and growth of organizations by countering board intervention and corporate power at the management level (Asma, 2010).
Brown and Caylor (2004)have explained in their study that those firms are profitable which are implementing corporate governance rules and regulations. Many US firms have high return on their assets, high firm’s value and high return on shares because of implementation of the corporate governance in true spirit. Corporate governance provides protection to shareholders and employees. OECD (1999)has extended the concept of corporate governance helping firms to achieve control.
According to Shleifer and Vishny (1997), value of firm is elevated by effective implementation of corporate governance, leading to proper monitoring, full disclosure of company information and a good transparency. This is very helpful in increasing investor’s trust on organization, decrease expropriation of minority shareholders rights, decrease risk of the firms, bettering operation activities of firm and reducing cost of auditing.
Following the empirical findings of various researchers, the following hypothesis is proposed:
H1: There is positive effect of corporate governance on firm’s value and bank’s performance.
Ownership Concentration
Claessens et al (2002) state that ownership concentration is the key element affecting firm’s performance. Li and Simerly (1998) state that ownership concentration positively effects firm performance and which makes possible for the firm to get high firm’s value and performance.
Gompers, Ishii and Metrick (2003) find that the firms with less ownership concentration have less market value with low profits. They also discuss that firm which has a high protection of the minority shareholders rights have high return and high firm’s value. So all investor want to invest their capital in safe environment where they get high return.
Stan?i? et al. (2012) find in their study that with increasing ownership concentration, the profitability of banks is mitigating in Serbia. Moreover, ownership concentration negatively influences the bank’s performance (Asma, 2010). Shleifer and Vishny (1986) explain that ownership concentration is more profitable for a firm when the owner provide compensation to manager for his best performance.
According to Franks, Mayer and Renneboog (2001), ownership concentration resolves the conflict within organization because monitoring of managers by shareholders have large benefits which change the performance of the firm. Hanafi, Muazaroh, Sudarmono and Tarazi (2015) establish that bank’s performance is adversely affected by ownership concentration.
Most of researchers show that the effects of ownership concentration have mixed results, but for this study, the following hypothesis is proposed:
H2: There is positive effect of ownership concentration on firm’s value and bank’s performance.
Bank Size
According to Williams (2003), the effect of the bank size on firm’s performance is studied extensively in the financial literature. Kagecha (2014) shows that bank size does not matter in determining bank’s profitability.
Redmond, Giradeau and Bonhansac (2007) and (2010) reported that bank size negatively affects the bank’s performance. Murthy (2008) explains in his study that bank size strongly affects the bank’s performance. He found that the large banks have high bank performance as compare to small banks in gulf countries.
Spathes (2002) examines that large banks have high profitability ratio as compare to small banks. Halkos and Salmouris (2004) state that banks carrying more assets have higher bank performance in Greece.
Following the empirical findings of various researchers, the following hypothesis is proposed:
H3: There is positive effect of bank size on firm’s value and bank’s performance.
Firm’s Value and Bank’s Performance
According to Gunawan, Effendie and Budi (2014), the high profitability shows high performance of the firm. Performance means that the firm gets all their goals in specified time and on low cost. High profitability comes from good environment, which helps in both managing and attracting customers. Wahla, Shah and Hussain (2012) show that management incentive is more important to hold for the high performance in future. Sheu and Yang (2005) explain that measuring performance refers to the efficient use of the firm resources to achieve the organization objective and goals. Gompers, Paul, Ishii, Metric and Joy (2003) state that if the corporation is giving protection and rights to their shareholder, it will directly increase the firm’s value, profits and sales as well. According to Mitten (2002), ownership concentration has positive link with firm’s value. Berle and Means (1932) identify in their study that concentrated ownership positively effects impact firm’s value and share price. Adams and Santos (2005) confirm that corporate governance positively effects firm’s performance over accounting and marketing base dimension.
Methodology Regressand and Regressors
The descriptions of the regressand and regressors are given bellow:
Table 1.
| Regressand and Regressors width="226" nowrap="">Definition width="105" nowrap="">Sources | > Ownership concentration width="226" nowrap="">Ownership concentration is the distribution of shares owned by majority shareholders. width="105" nowrap="">zakraia,( 2015) | > Corporate governance> width="226" nowrap="">Independent Directors and audit committee is taken as proxies for CG. width="105" nowrap="">Sula (2005) | > Bank size width="226" nowrap="">Total advances and total capital of bank is taken as proxy for Bank size. width="105" nowrap="">Sudarmadji and sularto, (2007) | > Firm’s value> > > width="226" nowrap="">Tobin’s Q is used as the proxy for the measurement of company value. Tobin’s q ratio is the ratio of the product of outstanding shares and market value per share divide by total assets. width="105" nowrap=""> | > Bank’s Performance width="226" nowrap="">Performance as a measure of firm’s profitability which is mostly measure through Return on Equity (ROE). width="105" nowrap=""> |
Population
In Pakistan there are different types of banks, such as government owned banks, public banks and private banks. As per the insight of the state bank of Pakistan, 27 commercial banks operated in Pakistan during 2006 till 2016. The population in this study is all commercial operating banks of Pakistan but only those banks is selected that started its operations before 2006 and has not merged or stopped operation till 2016.
Sample
The sample comprises of all commercial banks and data is collected covering a time span of 2006 to 2016. The data is collected from bank’s annual reports, government publications, World Bank database and IMF database.
Empirical Models
The following model is used in this study:
MODEL 1.
TBQ it=?+?1IDit+?2ACit+?3OCit+?4TAit+?5TCit+ ?
MODEL 2.
ROE it=?+?1IDit+?2ACit+?3OCit+?4TAit+?5TCit+ ?
Where:
TBQ=Tobin’s Q
ROE=Return on Equity
ID=Independent director
AC=Audit committee
OC=Ownership concentration
TA=Total advances
TC=Total capital
Results and analysis of model 1 Descriptive statistics of Model 1 Table 2.
| Variable width="36" nowrap="">Obs width="59" nowrap="">Mean width="65" nowrap="">Std. Dev. width="59" nowrap="">Minimum width="65" nowrap="">Maximum width="51" nowrap="">Skewness width="54" nowrap="">kurtosis | > Tobin's q width="36" nowrap="">187 width="59" nowrap="">11.8002 width="65" nowrap="">11.05668 width="59" nowrap="">1.01808 width="65" nowrap="">88.94638 width="51" nowrap="">1.2422 width="54" nowrap="">4.1045 | > Total capital width="36" nowrap="">187 width="59" nowrap="">16.5487 width="65" nowrap="">2.385087 width="59" nowrap="">0 width="65" nowrap="">18.94404 width="51" nowrap="">0.3488 width="54" nowrap="">3.9317 | > Total advances width="36" nowrap="">187 width="59" nowrap="">18.6132 width="65" nowrap="">1.176489 width="59" nowrap="">14.4041 width="65" nowrap="">20.52146 width="51" nowrap="">0.7974 width="54" nowrap="">3.3365 | > Independent director width="36" nowrap="">187 width="59" nowrap="">82.2282 width="65" nowrap="">10.25173 width="59" nowrap="">37.5 width="65" nowrap="">92.31 width="51" nowrap="">1.4641 width="54" nowrap="">4.8691 | > Audit committee width="36" nowrap="">187 width="59" nowrap="">3.73797 width="65" nowrap="">0.776539 width="59" nowrap="">3 width="65" nowrap="">6 width="51" nowrap="">0.6278 width="54" nowrap="">2.3645 | > Ownership Concentration width="36" nowrap="">187 width="59" nowrap="">55.5896 width="65" nowrap="">14.74002 width="59" nowrap="">19.99 width="65" nowrap="">84.51 width="51" nowrap="">0.0034 width="54" nowrap="">2.3716 |
Table No. 2 shows the descriptive statistics which consist of both dependent and independent variables. The total numbers of observations are 187. The minimum value of Tobin’s q ratio is 1.01 and maximum value is 88.94, its mean is 11.80 and its standard deviation is high 11.056. The minimum value of total capital is 0 and maximum value is 18.94, its mean is 16.54 and standard deviation is low i.e., 2.38. The total advances minimum value is 14.404 and maximum value is 20.52, its mean is 18.61 and standard deviation is low 1.176. The independent directors’ minimum value is 37.5 and maximum value is 92.31. This value is present in percentages, its mean is 82.22 and standard deviation is high 10.25. The audit committee minimum value is 3 and maximum value is 6, its mean is 3.73 and standard deviation is low 0.77. The ownership concentration minimum value is 19.99 and maximum is 84.51, its mean is 55.58 and standard deviation is 14.74. According to Gujarati (2003), the data will be normal if it has the skewness value below 2 and kurtosis value above 5, which in our case is fulfilled confirming that the data is normally distributed.
The above table shows all dependent and independent variables and their relationship with each other. It is very simple to know that from above table that all independent variable have less value than 0.80 recommended by Gujarati (2003). Now we have no problem of Multicollinearity in our consequence.
Regression Results
The fixed effects and random effects panel least square technique is employed in the study to perform regressions as according to (Fox, 1997), this is the most valid technique for assessing panel data sets.
Fixed Effects Panel Least Square model of model 1 Table 4.
| Tobin’s q ratio width="104" nowrap="">Coefficients width="92" nowrap="">Std Errors. width="95" nowrap="">T-Values width="68" nowrap="">P>|t| | > Total capital width="104" nowrap="">0.013979 width="92" nowrap="">0.012637 width="95" nowrap="">1.11 width="68" nowrap="">0.27 | > Total advances width="104" nowrap="">0.11585 width="92" nowrap="">0.017549 width="95" nowrap="">1.6 width="68" nowrap="">0.56 | > Independent directors width="104" nowrap="">0.0008 width="92" nowrap="">0.000761 width="95" nowrap="">1.05 width="68" nowrap="">0.297 | > Audit committee width="104" nowrap="">0.00288 width="92" nowrap="">0.012309 width="95" nowrap="">0.23 width="68" nowrap="">0.815 | > Ownership Concentration width="104" nowrap="">0.00035 width="92" nowrap="">0.000694 width="95" nowrap="">3.51 width="68" nowrap="">0.0414 | > Cons width="104" nowrap="">2.134755 width="92" nowrap="">0.250103 width="95" nowrap="">8.54 width="68" nowrap="">0.00 |
R-square= 0.3102
The above table shows relationship of independent variables with dependent variable. The R-square value is 31.02%. Total capital coefficient value is positive but insignificant. The total advances coefficient value is positive and insignificant. As total capital and total advances are proxy variable of bank size which shows that bank size has positive and insignificant influence on firm’s value. Independent director’s coefficient value is insignificant and positive relationship with Tobin’s q. Audit committee coefficient value is insignificant positive relationship with Tobin’s q, Independent directors and audit committee are indicators of corporate governance which shows positive and insignificant relationship with company value. Ownership concentration coefficient value show significant positive relationship with company value (Tobin’s q).
Random Effects GLS regression model 1 Table 5.
| Tobin’s q ratio width="101" nowrap="">Coefficients. width="103" nowrap="">Std Errors. width="66" nowrap="">z width="84" nowrap="">P>|z| | > Total capital width="101" nowrap="">0.025989 width="103" nowrap="">0.012277 width="66" nowrap="">1.12 width="84" nowrap="">2.12 | > Total advances width="101" nowrap="">0.05953 width="103" nowrap="">0.013247 width="66" nowrap="">1.49 width="84" nowrap="">0.765 | > Independent directors width="101" nowrap="">0.00137 width="103" nowrap="">0.000797 width="66" nowrap="">1.72 width="84" nowrap="">0.085 | > Audit committee width="101" nowrap="">0.006586 width="103" nowrap="">0.011342 width="66" nowrap="">0.58 width="84" nowrap="">0.561 | > Ownership Concentration width="101" nowrap="">0.00176 width="103" nowrap="">0.000612 width="66" nowrap="">2.88 width="84" nowrap="">0.004 | > Cons width="101" nowrap="">0.975075 width="103" nowrap="">0.178053 width="66" nowrap="">5.48 width="84" nowrap="">0 |
R-square = 0.2115
The table shows the relationship between independent and dependent variables. The R-square value is 21.15 %. That total capital coefficient value is positive and insignificant. The total advances coefficient value is positive and also has an insignificant value. The total capital and total advances are proxy variable of bank size which shows that bank size has positive and insignificant influence on firm’s value. Independent director’s coefficient value is insignificant and positive. Audit committee coefficient value is insignificant and positive. Independent directors and audit committee are indicators of corporate governance, which shows positive and insignificant relationship with firm’s value. Ownership concentration coefficient value is also show significant and positive, showing a positive relationship with firm’s value (Tobin’s q).
Hausman test of model 1 Table 6.
| Variables width="88" nowrap="">Fixed width="88" nowrap="">Random width="98" nowrap="">Difference width="76" nowrap="">S.E | > Total capital width="88" nowrap="">0.013979 width="88" nowrap="">0.025989 width="98" nowrap="">-0.01201 width="76" nowrap="">0.002994 | > Total advances width="88" nowrap="">-0.11585 width="88" nowrap="">-0.05953 width="98" nowrap="">-0.05632 width="76" nowrap="">0.01151 | > independent directors width="88" nowrap="">-0.0008 width="88" nowrap="">-0.00137 width="98" nowrap="">0.000576 width="76" nowrap="">0.0000 | > Audit committee width="88" nowrap="">-0.00288 width="88" nowrap="">0.006586 width="98" nowrap="">-0.00946 width="76" nowrap="">0.00478 | > Ownership concentration width="88" nowrap="">-0.00035 width="88" nowrap="">-0.00176 width="98" nowrap="">0.001409 width="76" nowrap="">0.000328 |
chi2 (5) =1.39
Prob>chi2 = 0.9841
The Hausman Test is employed to decide whether fixed effect least square model is an appropriate or Random Effect Least square model is the right choice. As per the p-value of 0.9841, the random effects least square model is the appropriate model to perform regressions.
Multicollinearity statistics of model 1 Table 7.
| Variable width="142" nowrap="">VIF width="127" nowrap="">1/VIF | > Total advances width="142" nowrap="">2.92 width="127" nowrap="">0.342671 | > Total capital width="142" nowrap="">2.71 width="127" nowrap="">0.368642 | > independent directors width="142" nowrap="">1.29 width="127" nowrap="">0.774755 | > Ownership Concentration width="142" nowrap="">1.12 width="127" nowrap="">0.889351 | > Audit committee width="142" nowrap="">1.03 width="127" nowrap="">0.968319 | > mean VIF width="142" nowrap="">1.82 width="127" nowrap=""> |
The above table shows that the problem of multicollinearity does not prevail, as VIF’s value (All variables) is less than 10.
Results and data analysis of model 2 Descriptive statistics of Model 2 Table 8
| Variable width="36" nowrap="">Obs width="60" nowrap="">Mean width="66" nowrap="">Std. Dev. width="60" nowrap="">Minimum width="60" nowrap="">Maximum width="56" nowrap="">Skewness width="55" nowrap="">Kurtosis | > ROE width="36" nowrap="">187 width="60" nowrap="">11.8002 width="66" nowrap="">11.0566 width="60" nowrap="">-37.00 width="60" nowrap="">35.55 width="56" nowrap="">1.4354 width="55" nowrap="">3.1045 | > Total capital width="36" nowrap="">187 width="60" nowrap="">16.5487 width="66" nowrap="">2.3850 width="60" nowrap="">0 width="60" nowrap="">18.9440 width="56" nowrap="">0.3488 width="55" nowrap="">3.9317 | > Total advances width="36" nowrap="">187 width="60" nowrap="">18.6132 width="66" nowrap="">1.1764 width="60" nowrap="">14.4041 width="60" nowrap="">20.5214 width="56" nowrap="">0.7974 width="55" nowrap="">3.3365 | > Independent director width="36" nowrap="">187 width="60" nowrap="">82.2282 width="66" nowrap="">10.2517 width="60" nowrap="">37.5 width="60" nowrap="">92.31 width="56" nowrap="">1.4641 width="55" nowrap="">4.8691 | > Audit committee width="36" nowrap="">187 width="60" nowrap="">3.73797 width="66" nowrap="">0.7765 width="60" nowrap="">3 width="60" nowrap="">6 width="56" nowrap="">0.6278 width="55" nowrap="">2.3645 | > Ownership concentration width="36" nowrap="">187 width="60" nowrap="">55.5896 width="66" nowrap="">14.74002 width="60" nowrap="">19.99 width="60" nowrap="">84.51 width="56" nowrap="">0.0034 width="55" nowrap="">2.3716 |
The above table shows descriptive statistics of both dependent and independent variables with 187 observations for all variables. The minimum value of ROE is -37.00 and maximum value is 35.55, its mean is 11.80 and its standard deviation is high with a value of 11.056. The total capital minimum value is 0 and maximum value is 18.94, its mean is 16.54 and standard deviation is low 2.38. The minimum value of total advances is 14.404 and its maximum value is 20.52, its mean is 18.61 with standard deviation of 1.176. The minimum value of independent director is 37.5 and its maximum value is 92.31, represented in percentages with a mean of 82.22 and standard deviation of 10.25. The minimum value of audit committee is 3 and maximum value is 6, with a mean of 3.73 and a low standard deviation of 0.77. The minimum value of ownership concentration is 19.99 and maximum value is 84.51 with a mean of 55.58 and standard deviation of 14.74. According to Gujarati (2003), the data will be normal if it has the skewness value less than 2 and kurtosis value less than 5 which shows that the data is normally distributed. In our data, the skewness value is less than 2 and kurtosis value is less than 5, which shows data are normal.
Correlation matrix of model 2 Table 9.
| Variables width="61" nowrap="">ROE width="61" nowrap="">Total Advances width="61" nowrap="">Total Capital width="61" nowrap="">independent Director width="61" nowrap="">Audit Committee width="53" nowrap="">Owners Concentration | > ROE width="61" nowrap="">1 width="61" nowrap=""> width="61" nowrap=""> width="61" nowrap=""> width="61" nowrap=""> width="53" nowrap=""> | > Total advances width="61" nowrap="">0.5231 width="61" nowrap="">1 width="61" nowrap=""> width="61" nowrap=""> width="61" nowrap=""> width="53" nowrap=""> | > Total capital width="61" nowrap="">0.4901 width="61" nowrap="">0.7896 width="61" nowrap="">1 width="61" nowrap=""> width="61" nowrap=""> width="53" nowrap=""> | > independent director width="61" nowrap="">0.4798 width="61" nowrap="">0.4373 width="61" nowrap="">0.3907 width="61" nowrap="">1 width="61" nowrap=""> width="53" nowrap=""> | > Audit committee width="61" nowrap="">0.1366 width="61" nowrap="">0.146 width="61" nowrap="">0.1546 width="61" nowrap="">0.1383 width="61" nowrap="">1 width="53" nowrap=""> | > Ownership Concentration width="61" nowrap="">0.3573 width="61" nowrap="">0.2751 width="61" nowrap="">0.165 width="61" nowrap="">0.2628 width="61" nowrap="">0.0611 width="53" nowrap="">1 |
Table 9 shows the correlation matrix of ROE with variables. The correlation coefficient value of total advances is 0.523, which shows there is a positive relationship between total advances and ROE. Total capital value is 0.4901, which shows that if there is 1 percent change in ROE, total capital will increase by 49.01 percent. Independent director’s value is 0.4798, which shows a positive relationship. Audit committee has value of 0.1366, which shows a positive relationship as well. Ownership concentration has a value of0.3573. There is no presence of multicollinearity in data description.
Fixed effect panel least square model of model 2 Table 10.
| ROE width="120" nowrap="">Coefficients width="90" nowrap="">St Errors. width="78" nowrap="">T-Values width="72" nowrap="">P>|t| | > Total capital width="120" nowrap="">8.763247 width="90" nowrap="">4.301164 width="78" nowrap="">2.0400 width="72" nowrap="">0.0430 | > Total advances width="120" nowrap="">17.7114 width="90" nowrap="">18.1395 width="78" nowrap="">2.9800 width="72" nowrap="">0.0300 | > Independent directors width="120" nowrap="">4.849309 width="90" nowrap="">0.955367 width="78" nowrap="">5.0800 width="72" nowrap="">0.0000 | > Audit committee width="120" nowrap="">9.22395 width="90" nowrap="">15.6626 width="78" nowrap="">2.5900 width="72" nowrap="">0.031 | > Ownership Concentration width="120" nowrap="">1.13525 width="90" nowrap="">0.881811 width="78" nowrap="">1.2900 width="72" nowrap="">0.2000 | > _cons width="120" nowrap="">-113.276 width="90" nowrap="">317.7849 width="78" nowrap="">-0.3600 width="72" nowrap="">0.7220 |
R-square = 0.3662
The above table shows relationship of dependent variable with independent variables. The R-square value is 36.62%. Total capital coefficient value is positive and significant. The total advances coefficient value is positive and also has a significant value. As the total capital and total advances are proxy variables for bank size, which shows a positive and significant impact on bank’s performance. Independent director’s coefficient value is positive and significant. Audit committee coefficient value is also significant and positive. As the independent directors and audit committee are proxy variables for corporate governance, which shows a positive and significant relationship with bank’s performance.
Random-effects GLS regression of model 2 Table 11.
| ROE width="108" nowrap="">Coefficients. width="96" nowrap="">Std. Err. width="72" nowrap="">Z width="72" nowrap="">P>|z| | > Total capital width="108" nowrap="">8.223808 width="96" nowrap="">3.756268 width="72" nowrap="">3.19 width="72" nowrap="">0.029 | > Total advances width="108" nowrap="">11.4174 width="96" nowrap="">9.714228 width="72" nowrap="">3.18 width="72" nowrap="">0.024 | > Independent directors width="108" nowrap="">4.416706 width="96" nowrap="">0.872348 width="72" nowrap="">5.06 width="72" nowrap="">0.0000 | > Audit committee width="108" nowrap="">9.91502 width="96" nowrap="">11.81874 width="72" nowrap="">3.17 width="72" nowrap="">0.023 | > Ownership Concentration width="108" nowrap="">0.89668 width="96" nowrap="">0.634608 width="72" nowrap="">1.41 width="72" nowrap="">0.158 | > _cons width="108" nowrap="">196.607 width="96" nowrap="">173.9634 width="72" nowrap="">1.13 width="72" nowrap="">0.258 |
R-square = 0.3653
The table shows the independent variables influence on dependent variable. The R-square value is 36.53%. Total capital coefficient value is positive and statistically significant. The total advances coefficient value is positive significant. Therefore, Total capital and total advances are proxy variables fir bank size, which shows that bank size have positive and significant effect on bank’s performance. Independent director’s coefficient value is significant and positive. Audit committee coefficient value is significant and positive. Both are proxy variables for corporate governance, which recognize that corporate governance has a significant and positive effect on bank’s performance. Ownership concentration coefficient value is insignificant but shows a positive relationship with bank’s performance (ROE).
Hausman Test of model 2 Table 12.
| Variables width="84" nowrap="">Fixed width="96" nowrap="">Random width="114" nowrap="">Difference width="70" nowrap="">S.E | > Total capital width="84" nowrap="">8.763247 width="96" nowrap="">8.223808 width="114" nowrap="">0.53944 width="70" nowrap="">2.095342 | > Total advances width="84" nowrap="">-17.7114 width="96" nowrap="">-11.4174 width="114" nowrap="">-6.29398 width="70" nowrap="">15.31912 | > independent directors width="84" nowrap="">4.849309 width="96" nowrap="">4.416706 width="114" nowrap="">0.432603 width="70" nowrap="">0.389533 | > Audit committee width="84" nowrap="">-9.22395 width="96" nowrap="">-9.91502 width="114" nowrap="">0.691075 width="70" nowrap="">10.27786 | > Ownership concentration width="84" nowrap="">-1.13525 width="96" nowrap="">-0.89668 width="114" nowrap="">-0.23857 width="70" nowrap="">0.61226 |
chi2 (5) =1.47
Prob>chi2 = 0.9256
The Hausman Test is employed to decide whether fixed effect least square model is an appropriate or Random Effect Least square model is the right choice. As per the p-value of 0.9256, the random effects least square model is the appropriate model to perform regressions.
Multicollinearity Statistics Table 13.
| Variable width="150" nowrap="">VIF width="168" nowrap="">1/VIF | > Total advances width="150" nowrap="">1.42 width="168" nowrap="">0.706228 | > Total capital width="150" nowrap="">1.28 width="168" nowrap="">0.368642 | > independent directors width="150" nowrap="">1.16 width="168" nowrap="">0.865669 | > Ownership Concentration width="150" nowrap="">1.12 width="168" nowrap="">0.895789 | > Audit committee width="150" nowrap="">1.05 width="168" nowrap="">0.954331 | > mean VIF width="150" nowrap="">1.2 width="168" nowrap=""> |
The above table shows that the problem of multicollinearity does not prevail, as VIF’s value (All variables) is less than 10.
Conclusion and Suggestions for further Research Conclusion
Our results show that corporate governance has a positive and significant impact on firm’s value and bank’s performance. Regression analysis also indicates that the ownership concentration positively affects the firm’s value. Empirical results also indicate that ownership concentration of banks hasan insignificant but positive influence on its financial performance. The bank size has a positive relationship with bank’s performance and firm’s value in Pakistan.
Suggestions for Further Research
The study focuses only on the banking industry of Pakistan. So further new sectors may be explored keeping in view the same set of variables. Furthermore, corporate disclosure practices, board characteristics, CEO compensation and executive education should be made part of future studies.
References
- Adams, R., & H. Mehran (2003),
- Adams, R., & J. Santos (2005),
- Ahmad, A. (2010),
- Berle, A., & G. Means (1932),
- Bikker, J. A., & J. W. Bos (2008),
- Cornwall, L. (2007),
- Gompers, Paul, A., Ishii, Metric, & L. Joy (2003),
- Gunawan, R. M., Effendie, & D. Budi (2014),
- Halkos, G., & D. Salmouris (2004),
- Hanafi, M. M., Muazaroh, Sudarmono, W., & A. Tarazi (2015),
- Kagecha, P. K. (2014),
- Keown, A., Martin, J., Petty, & D. Scott, (2005),
- Li, M., and R. Simerly, (1998),
- Lopez-de-Silanes, F., Shleifer, A., & R. Vishny, (2000),
- Murthy, R. (2008),
- OECD. (1999),
- OECD. (2004),
- Redmond, Giradeau, & Bonhansac, (2007),
- Sheu, & Yang, (2005),
- Shleifer, A., & R. Vishny, (1986),
- Shleifer, A., and R. Vishny, (1997),
- Wahla, K.-U.-R., Shah, S., & Z. Husssain, (2012),
- Williams, B. (2003),
Cite this article
-
APA : Khan, I., Ahmad, W., & Shah, S. A. A. (2020). Assessing the influence of Corporate Governance, Ownership Concentration and Bank Size on the Firm's Value and Bank's Performance: Evidence from Pakistan. Global Economics Review, V(IV), 34-46. https://doi.org/10.31703/ger.2020(V-IV).04
-
CHICAGO : Khan, Ihtesham, Wisal Ahmad, and Syed Arshad Ali Shah. 2020. "Assessing the influence of Corporate Governance, Ownership Concentration and Bank Size on the Firm's Value and Bank's Performance: Evidence from Pakistan." Global Economics Review, V (IV): 34-46 doi: 10.31703/ger.2020(V-IV).04
-
HARVARD : KHAN, I., AHMAD, W. & SHAH, S. A. A. 2020. Assessing the influence of Corporate Governance, Ownership Concentration and Bank Size on the Firm's Value and Bank's Performance: Evidence from Pakistan. Global Economics Review, V, 34-46.
-
MHRA : Khan, Ihtesham, Wisal Ahmad, and Syed Arshad Ali Shah. 2020. "Assessing the influence of Corporate Governance, Ownership Concentration and Bank Size on the Firm's Value and Bank's Performance: Evidence from Pakistan." Global Economics Review, V: 34-46
-
MLA : Khan, Ihtesham, Wisal Ahmad, and Syed Arshad Ali Shah. "Assessing the influence of Corporate Governance, Ownership Concentration and Bank Size on the Firm's Value and Bank's Performance: Evidence from Pakistan." Global Economics Review, V.IV (2020): 34-46 Print.
-
OXFORD : Khan, Ihtesham, Ahmad, Wisal, and Shah, Syed Arshad Ali (2020), "Assessing the influence of Corporate Governance, Ownership Concentration and Bank Size on the Firm's Value and Bank's Performance: Evidence from Pakistan", Global Economics Review, V (IV), 34-46
-
TURABIAN : Khan, Ihtesham, Wisal Ahmad, and Syed Arshad Ali Shah. "Assessing the influence of Corporate Governance, Ownership Concentration and Bank Size on the Firm's Value and Bank's Performance: Evidence from Pakistan." Global Economics Review V, no. IV (2020): 34-46. https://doi.org/10.31703/ger.2020(V-IV).04